

Question: Table of factors: Chart Option A: Chart Option B: Chart Option C: Chart Option D: Chart D is an incorrect answer The Money Pit Mortgage
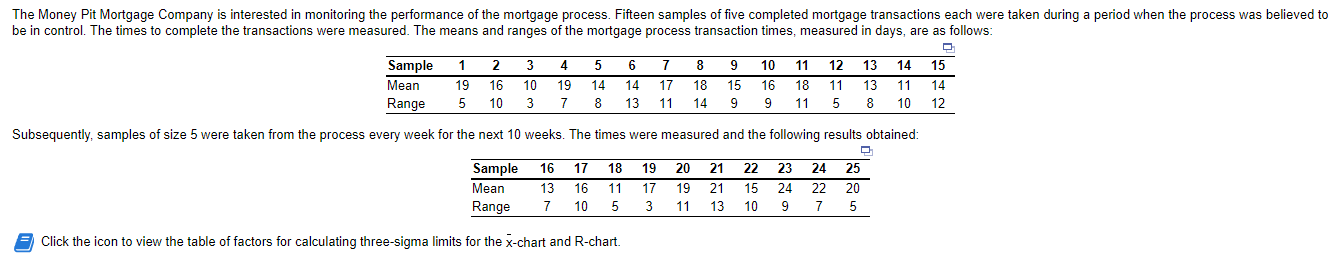
Table of factors:
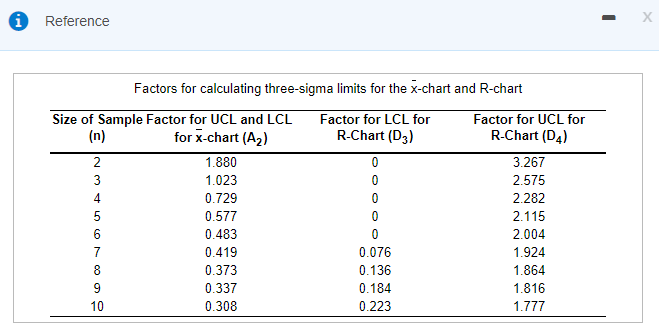
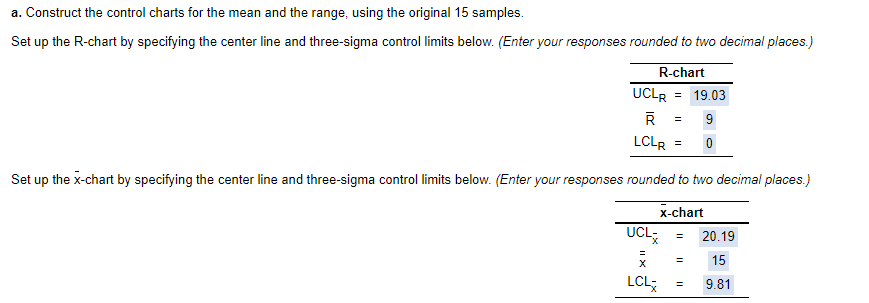

Chart Option A:
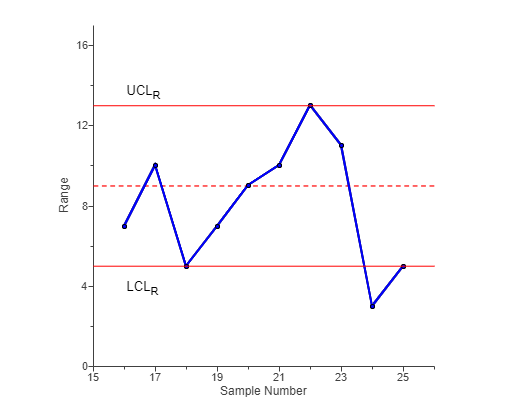
Chart Option B:
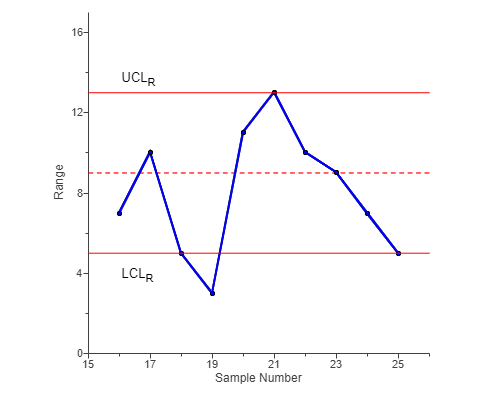
Chart Option C:
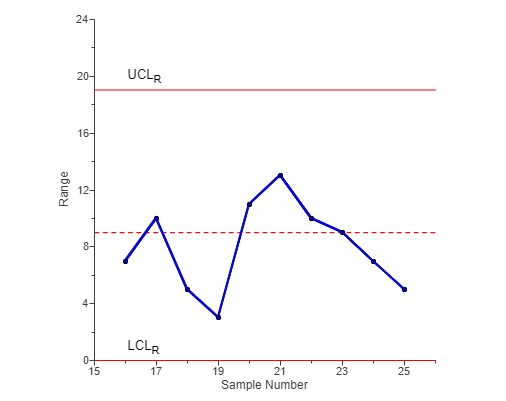
Chart Option D:
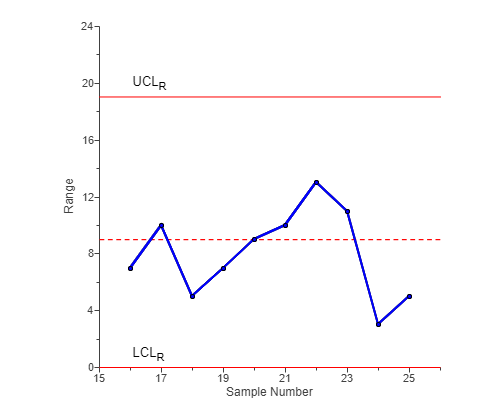
Chart D is an incorrect answer
The Money Pit Mortgage Company is interested in monitoring the performance of the mortgage process. Fifteen samples of five completed mortgage transactions each were taken during a period when the process was believed to be in control. The times to complete the transactions were measured. The means and ranges of the mortgage process transaction times, measured in days, are as follows: Sample 1 2 3 4 5 6 7 8 9 10 11 12 13 14 15 Mean 1916 10 19 14 14 17 18 15 16 18 11 13 11 14 Range 5 10 3 7 13 11 14 9 9 11 5 8 10 12 Subsequently, samples of size 5 were taken from the process every week for the next 10 weeks. The times were measured and the following results obtained: 8 Sample Mean Range 16 13 7 17 16 10 18 11 5 19 17 3 20 19 11 21 21 13 22 23 15 24 10 9 24 25 22 20 7 5 Click the icon to view the table of factors for calculating three-sigma limits for the x-chart and R-chart. Reference - Factors for calculating three-sigma limits for the x-chart and R-chart Size of Sample Factor for UCL and LCL Factor for LCL for Factor for UCL for (n) for X-chart (A2) R-Chart (D3) R-Chart (D4) 2 1.880 0 3.267 3 1.023 0 2.575 0.729 0 2.282 5 0.577 0 2.115 6 0.483 0 2.004 7 0.419 0.076 1.924 8 0.373 0.136 1.864 9 0.337 0.184 1.816 10 0.308 0.223 1.777 4 a. Construct the control charts for the mean and the range, using the original 15 samples. Set up the R-chart by specifying the center line and three-sigma control limits below. (Enter your responses rounded to two decimal places.) R-chart UCLR = 19.03 R 9 LCLR = 0 = Set up the x-chart by specifying the center line and three-sigma control limits below. (Enter your responses rounded to two decimal places.) x-chart UCL 20.19 15 LCL 9.81 XIL b. On the control charts developed in part (a), plot the values from samples 16 through 25 and comment on whether the process is in control. Choose the correct R-chart for the data below. 16- UCLR 12- Range 1 q 4- LCLR 0+ 15 17 23 25 19 21 Sample Number 16- UCLR 12- Range 4- LCLR 0+ 15 17 23 25 19 21 Sample Number 24 20 UCLR 16- Range 12- LCLR 04 15 17 23 25 19 21 Sample Number 24 20- UCLR 16- Range 12- 8- n LCLR 0- 15 17 23 25 19 21 Sample Number
Step by Step Solution
There are 3 Steps involved in it
1 Expert Approved Answer
Step: 1 Unlock

Question Has Been Solved by an Expert!
Get step-by-step solutions from verified subject matter experts
Step: 2 Unlock
Step: 3 Unlock