

Question: Table One Reductions Building A Building B 3006.10 2 3001.12 3006.10 3 30 01.52 3006.10 4 3002.05 3006.10 5 3002.77 3006.10 6 3004.73 3006.10 7


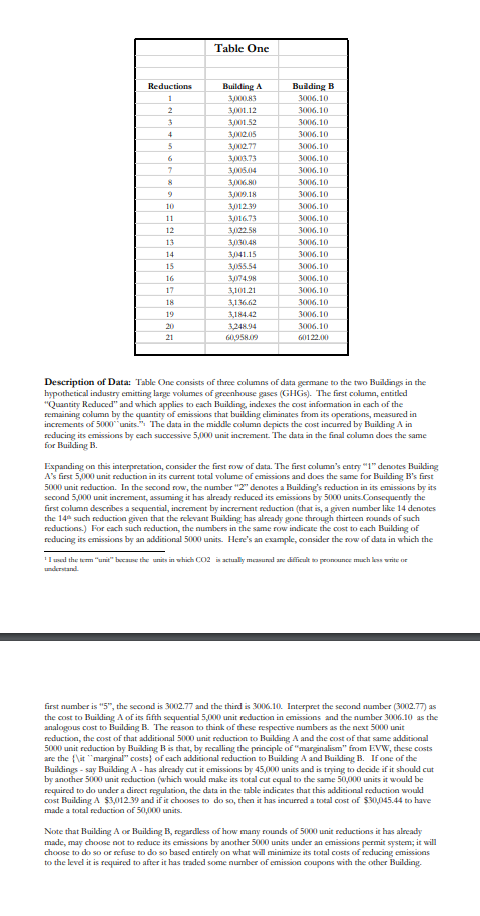
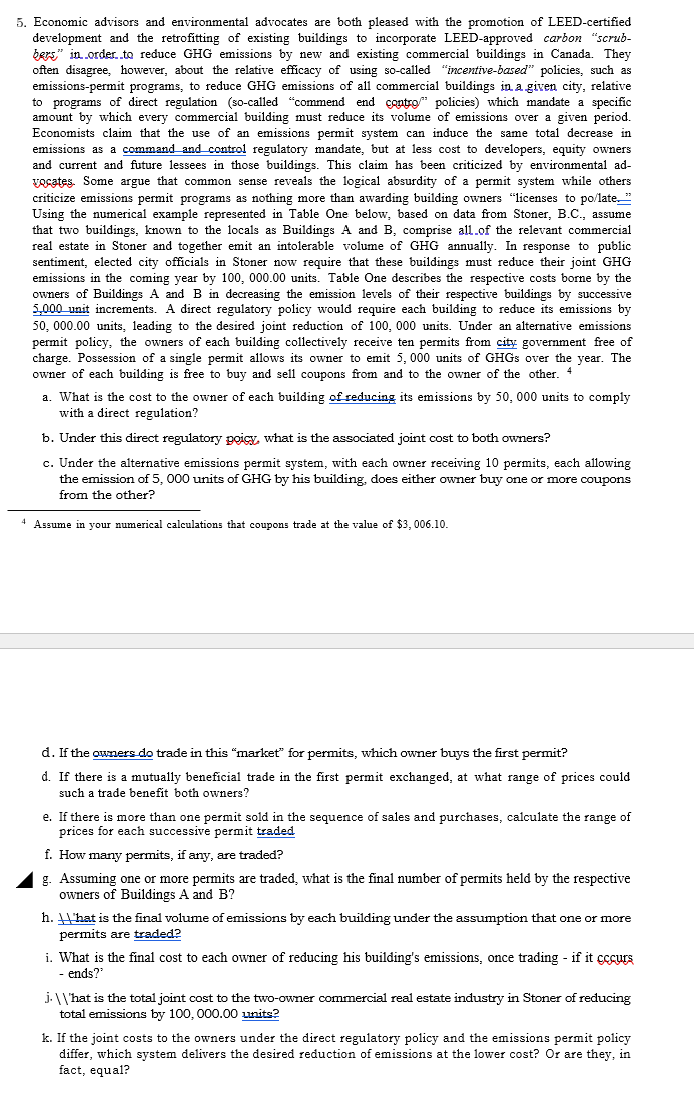
Table One Reductions Building A Building B 3006.10 2 3001.12 3006.10 3 30 01.52 3006.10 4 3002.05 3006.10 5 3002.77 3006.10 6 3004.73 3006.10 7 3,005.04 3006.10 8 3,006.80 3006.10 9 3009.18 3006.10 10 301 230 3006.10 11 3,01 6.73 3006.10 12 3022.58 3006.10 13 3,03048 3006.10 14 30-41.15 3006.10 15 3055.54 3006.10 16 3074.98 3006.10 17 3,101.21 3006.10 18 3,136.62 3006.10 19 3,184.42 3006.10 20 3248.94 3006.10 21 601 22 00 Description of Data: Table One consists of three columns of data germane to the two Buildings in the hypothetical industry emitting large volumes of greenhouse gases (GHGs). The first column, entitled "Quantity Reduced" and which applies to each Building, indexes the cost information in each of the remaining column by the quantity of emissions that building eliminates from its operations, measured in increments of 5000""units.". The data in the middle column depicts the cost incurred by Building A in reducing its emissions by each successive 5,000 unit increment. The data in the final column does the same for Building B. Expanding on this interpretation, consider the first row of data. The first column's entry "1" denotes Building A's first 5,000 unit reduction in its current total volume of emissions and does the same for Building B's first 5000 unit reduction. In the second row, the number "2" denotes a Building's reduction in its emissions by its second 5,000 unit increment, assuming it has already reduced its emissions by 5000 units Consequently the first column describes a sequential, increment by increment reduction (that is, a given number like 14 denotes the 14 such reduction given that the relevant Building has already gone through thirteen rounds of such reductions.) For each such reduction, the numbers in the same row indicate the cost to each Building of reducing its emissions by an additional 5000 units. Here's an example, consider the wow of data in which the I used the team "unit" because the units in which CO2 is actually measunal are dificult to pronounce much has write or understand first number is "5", the second is 3002.77 and the third is 3006.10. Interpret the second number (3002.77) as the cost to Building A of its fifth sequential 5,000 unit reduction in emissions and the number 3006.10 as the analogous cost to Building B. The reason to think of these respective numbers as the next 5000 unit reduction, the cost of that additional 5000 unit reduction to Building A and the cost of that same additional 5000 unit reduction by Building B is that, by recalling the principle of "marginalism" from EVW, these costs are the {\\it "marginal" costs) of each additional reduction to Building A and Building B. If one of the Buildings - say Building A - has already cut it emissions by 45,000 units and is trying to decide if it should cut by another 5000 unit reduction (which would make its total cut equal to the same 50,000 units it would be required to do under a direct regulation, the data in the table indicates that this additional reduction would cost Building A $3,012.39 and if it chooses to do so, then it has incurred a total cost of $30,045.44 to have made a total reduction of 50,000 units. Note that Building A or Building B, regardless of how many rounds of 5000 unit reductions it has already made, may choose not to reduce its emissions by another 5000 units under an emissions permit system; it will choose to do so or refuse to do so based entirely on what will minimize its total costs of reducing emissions to the level it is required to after it has traded some number of emission coupons with the other Building.5. Economic advisors and environmental advocates are both pleased with the promotion of LEED-certified development and the retrofitting of existing buildings to incorporate LEED-approved carbon "scrub- bers" in order to reduce GHG emissions by new and existing commercial buildings in Canada. They often disagree, however, about the relative efficacy of using so-called "incentive-based" policies, such as emissions-permit programs, to reduce GHG emissions of all commercial buildings in a given city, relative to programs of direct regulation (so-called "commend end contro/" policies) which mandate a specific amount by which every commercial building must reduce its volume of emissions over a given period. Economists claim that the use of an emissions permit system can induce the same total decrease in emissions as a command and control regulatory mandate, but at less cost to developers, equity owners and current and future lessees in those buildings. This claim has been criticized by environmental ad- Tocates Some argue that common sense reveals the logical absurdity of a permit system while others criticize emissions permit programs as nothing more than awarding building owners "licenses to po/late," Using the numerical example represented in Table One below, based on data from Stoner, B.C., assume that two buildings, known to the locals as Buildings A and B, comprise all of the relevant commercial real estate in Stoner and together emit an intolerable volume of GHG annually. In response to public sentiment, elected city officials in Stoner now require that these buildings must reduce their joint GHG emissions in the coming year by 100, 000.00 units. Table One describes the respective costs borne by the owners of Buildings A and B in decreasing the emission levels of their respective buildings by successive 5,000 unit increments. A direct regulatory policy would require each building to reduce its emissions by 50, 000.00 units, leading to the desired joint reduction of 100, 000 units. Under an alternative emissions permit policy, the owners of each building collectively receive ten permits from city government free of charge. Possession of a single permit allows its owner to emit 5, 000 units of GHGs over the year. The owner of each building is free to buy and sell coupons from and to the owner of the other. a. What is the cost to the owner of each building of reducing its emissions by 50, 000 units to comply with a direct regulation? b. Under this direct regulatory poicy, what is the associated joint cost to both owners? c. Under the alternative emissions permit system, with each owner receiving 10 permits, each allowing the emission of 5, 000 units of GHG by his building, does either owner buy one or more coupons from the other? Assume in your numerical calculations that coupons trade at the value of $3, 006.10. d. If the owners do trade in this "market" for permits, which owner buys the first permit? d. If there is a mutually beneficial trade in the first permit exchanged, at what range of prices could such a trade benefit both owners? e. If there is more than one permit sold in the sequence of sales and purchases, calculate the range of prices for each successive permit traded f. How many permits, if any, are traded? g. Assuming one or more permits are traded, what is the final number of permits held by the respective owners of Buildings A and B? h. \\What is the final volume of emissions by each building under the assumption that one or more permits are traded? i. What is the final cost to each owner of reducing his building's emissions, once trading - if it cccurs - ends?' i. \\\\hat is the total joint cost to the two-owner commercial real estate industry in Stoner of reducing total emissions by 100, 000.00 units? k. If the joint costs to the owners under the direct regulatory policy and the emissions permit policy differ, which system delivers the desired reduction of emissions at the lower cost? Or are they, in fact, equal
Step by Step Solution
There are 3 Steps involved in it

Get step-by-step solutions from verified subject matter experts