

Question: Table one shows data on lithic tool counts from Weasel Cave by excavation unit and sublevel in layer 12. Since sublevel B is underneath A
Table one shows data on lithic tool counts from Weasel Cave by excavation unit and sublevel in layer 12. Since sublevel B is underneath A it is interesting to explore the degree to which the tool counts from the two sublevels may be the same or different.
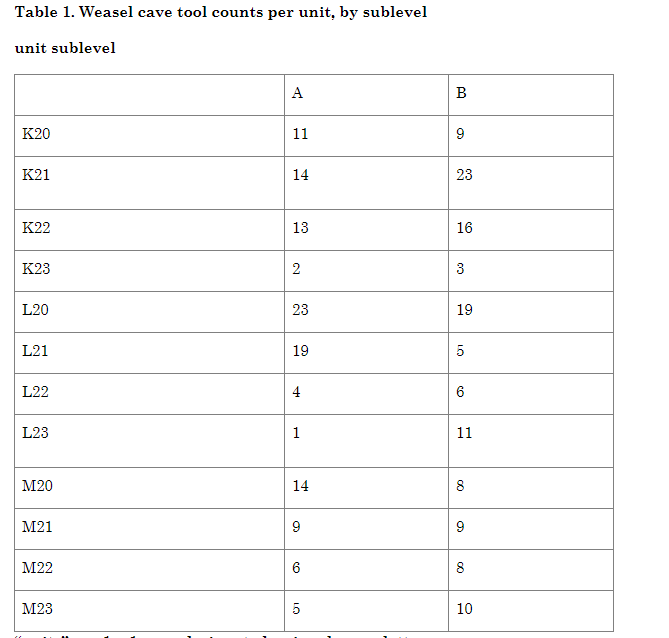
units are 1 x 1 m sq designated uniquely on a letter
and number grid, so the K, L, M lines are all adjacent.
Like this looking down: K20, K21, K22, K23
L20, L21, L22, L23
M20, M21, M22, M23
The data is from a single block of 12 1 x 1 units.
3.) We could also examine the rank-order relationships involved, and ask if the tool counts from each level come from the same underlying populations. Therefor use the Mann-Whitney U and Wilcoxon Rank Sum tests to examine these relationships. Is it clear that the sublevels are statistically independent samples ?
A) the null and alternative hypotheses,
B) the significance level (alpha),
C) the critical values (or probabilities) involved, and
D) which tables (if any) were consulted,
E) the calculated test statistic
F) whether the null hypothesis is rejected, or not rejected.
Table 1. Weasel cave tool counts per unit, by sublevel unit sublevel A B K20 11 9 K21 14 23 K22 13 16 K23 2 3 L20 23 19 L21 19 5 L22 4 6 L23 1 11 M20 14 8 M21 9 9 M22 6 8 M23 5 10 Table 1. Weasel cave tool counts per unit, by sublevel unit sublevel A B K20 11 9 K21 14 23 K22 13 16 K23 2 3 L20 23 19 L21 19 5 L22 4 6 L23 1 11 M20 14 8 M21 9 9 M22 6 8 M23 5 10Step by Step Solution
There are 3 Steps involved in it

Get step-by-step solutions from verified subject matter experts