

Question: Table one shows data on lithic tool counts from Weasel Cave by excavation unit and sublevel in layer 12. Since sublevel B is underneath A
Table one shows data on lithic tool counts from Weasel Cave by excavation unit and sublevel in layer 12. Since sublevel B is underneath A it is interesting to explore the degree to which the tool counts from the two sublevels may be the same or different.
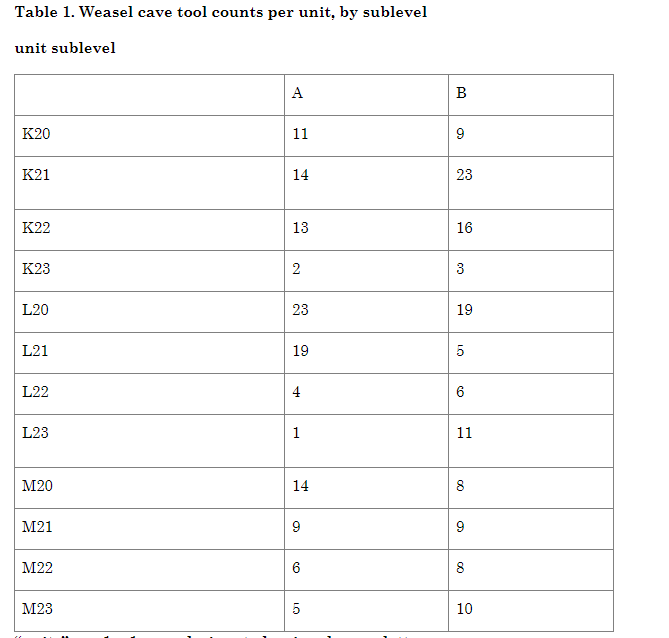
units are 1 x 1 m sq designated uniquely on a letter
and number grid, so the K, L, M lines are all adjacent.
Like this looking down: K20, K21, K22, K23
L20, L21, L22, L23
M20, M21, M22, M23
The data is from a single block of 12 1 x 1 units.
5. Assuming that a line is the best model for the data, calculate and plot the least squares best fit line for the data.
Table 1. Weasel cave tool counts per unit, by sublevel unit sublevel A B K20 11 9 K21 14 23 K22 13 16 K23 2 3 L20 23 19 L21 19 5 L22 4 6 L23 1 11 M20 14 8 M21 9 9 M22 6 8 M23 5 10Step by Step Solution
There are 3 Steps involved in it
1 Expert Approved Answer
Step: 1 Unlock

Question Has Been Solved by an Expert!
Get step-by-step solutions from verified subject matter experts
Step: 2 Unlock
Step: 3 Unlock