

Table shows financial statements for Apple Computer Corporation. The closing stock price for Apple was $68.11...
Fantastic news! We've Found the answer you've been seeking!
Question:
Transcribed Image Text:
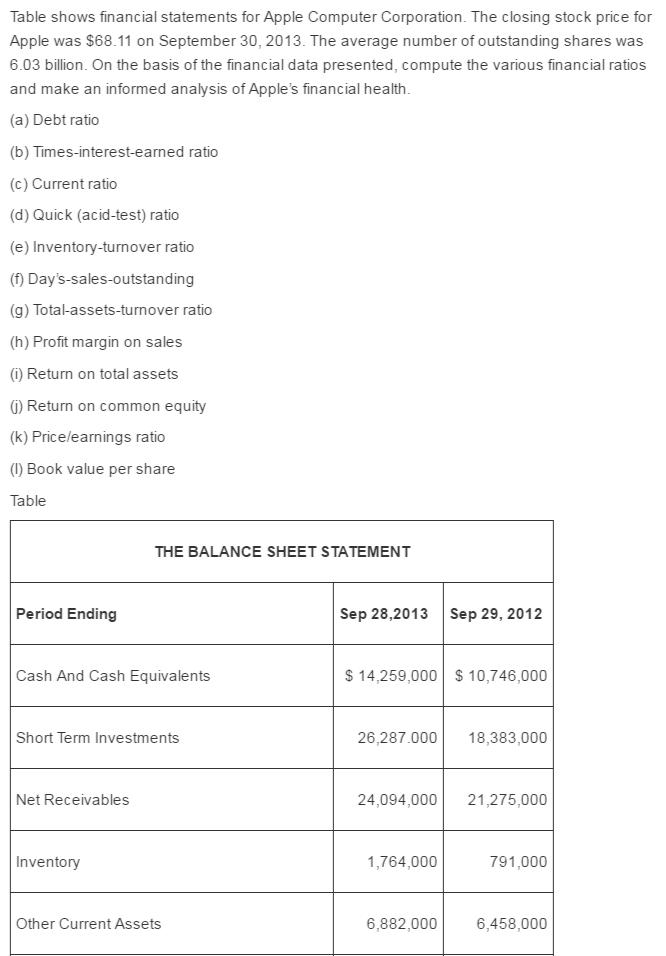
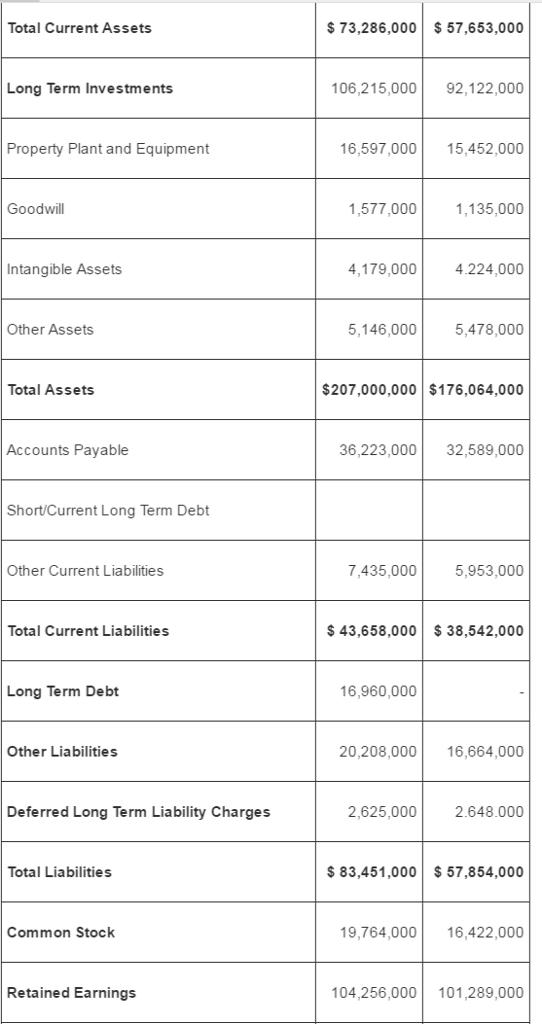
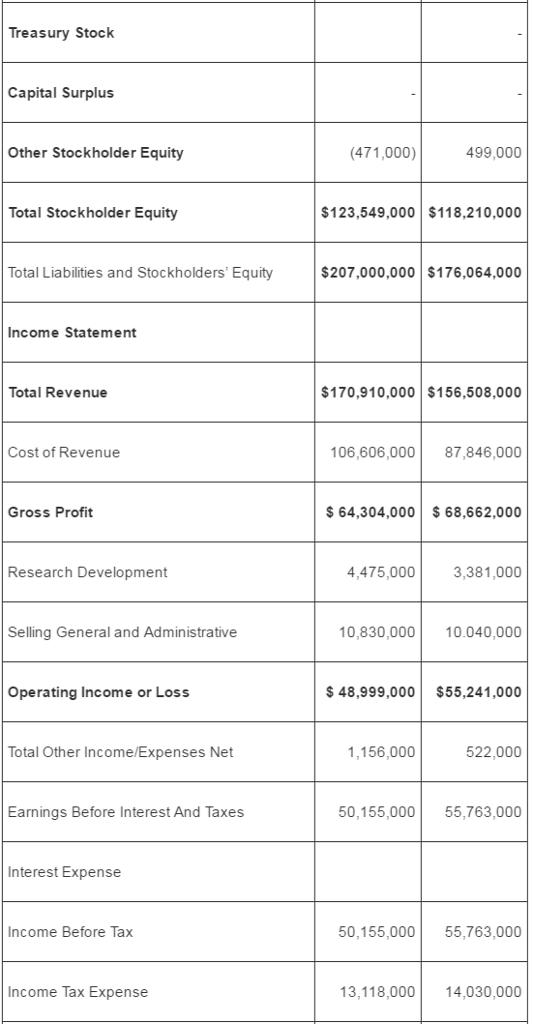
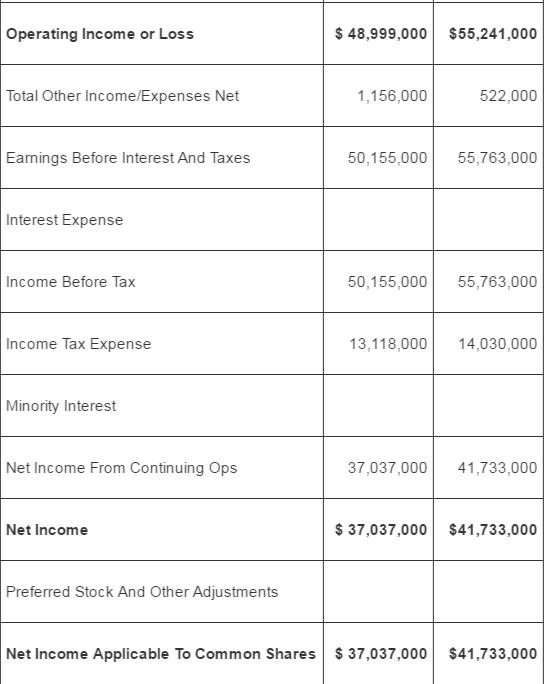
Table shows financial statements for Apple Computer Corporation. The closing stock price for Apple was $68.11 on September 30, 2013. The average number of outstanding shares was 6.03 billion. On the basis of the financial data presented, compute the various financial ratios and make an informed analysis of Apple's financial health. (a) Debt ratio (b) Times-interest-earned ratio (c) Current ratio (d) Quick (acid-test) ratio (e) Inventory-turnover ratio (f) Day's-sales-outstanding (g) Total-assets-turnover ratio (h) Profit margin on sales (i) Return on total assets G) Return on common equity (k) Pricelearnings ratio (1) Book value per share Table THE BALANCE SHEET STATEMENT Period Ending Sep 28,2013 Sep 29, 2012 Cash And Cash Equivalents $ 14,259,000 $ 10,746,000 Short Term Investments 26,287.000 18,383,000 Net Receivables 24,094,000 21,275,000 Inventory 1,764,000 791,000 Other Current Assets 6,882,000 6,458,000 Total Current Assets $ 73,286,000 $ 57,653,000 Long Term Investments 106,215,000 92,122,000 Property Plant and Equipment 16,597,000 15,452,000 Goodwill 1,577,000 1,135,000 Intangible Assets 4,179,000 4.224,000 Other Assets 5,146,000 5,478,000 Total Assets $207,000,000 $176,064,000 Accounts Payable 36,223,000 32,589,000 Short/Current Long Term Debt Other Current Liabilities 7,435,000 5,953,000 Total Current Liabilities $ 43,658,000 $ 38,542,000 Long Term Debt 16,960,000 Other Liabilities 20,208,000 16,664,000 Deferred Long Term Liability Charges 2,625,000 2.648.000 Total Liabilities $ 83,451,000 $ 57,854,000 Common Stock 19,764,000 16,422,000 Retained Earnings 104,256,000 101,289,000 Treasury Stock Capital Surplus Other Stockholder Equity (471,000) 499,000 Total Stockholder Equity $123,549,000 $118,210,000 Total Liabilities and Stockholders' Equity $207,000,000 $176,064,000 Income Statement Total Revenue $170,910,000 $156,508,000 Cost of Revenue 106,606,000 87,846,000 Gross Profit $ 64,304,000 $ 68,662,000 Research Development 4,475,000 3,381,000 Selling General and Administrative 10,830,000 10.040,000 Operating Income or Loss $ 48,999,000 $55,241,000 Total Other Income/Expenses Net 1,156,000 522,000 Earnings Before Interest And Taxes 50,155,000 55,763,000 Interest Expense Income Before Tax 50,155,000 55,763,000 Income Tax Expense 13,118,000 14,030,000 Operating Income or Loss $ 48,999,000 $55,241,000 Total Other Income/Expenses Net 1,156,000 522,000 Earnings Before Interest And Taxes 50,155,000 55,763,000 Interest Expense Income Before Tax 50,155,000 55,763,000 Income Tax Expense 13,118,000 14,030,000 Minority Interest Net Income From Continuing Ops 37,037,000 41,733,000 Net Income $ 37,037,000 $41,733,000 Preferred Stock And Other Adjustments Net Income Applicable To Common Shares $ 37,037,000 $41,733,000 Table shows financial statements for Apple Computer Corporation. The closing stock price for Apple was $68.11 on September 30, 2013. The average number of outstanding shares was 6.03 billion. On the basis of the financial data presented, compute the various financial ratios and make an informed analysis of Apple's financial health. (a) Debt ratio (b) Times-interest-earned ratio (c) Current ratio (d) Quick (acid-test) ratio (e) Inventory-turnover ratio (f) Day's-sales-outstanding (g) Total-assets-turnover ratio (h) Profit margin on sales (i) Return on total assets G) Return on common equity (k) Pricelearnings ratio (1) Book value per share Table THE BALANCE SHEET STATEMENT Period Ending Sep 28,2013 Sep 29, 2012 Cash And Cash Equivalents $ 14,259,000 $ 10,746,000 Short Term Investments 26,287.000 18,383,000 Net Receivables 24,094,000 21,275,000 Inventory 1,764,000 791,000 Other Current Assets 6,882,000 6,458,000 Total Current Assets $ 73,286,000 $ 57,653,000 Long Term Investments 106,215,000 92,122,000 Property Plant and Equipment 16,597,000 15,452,000 Goodwill 1,577,000 1,135,000 Intangible Assets 4,179,000 4.224,000 Other Assets 5,146,000 5,478,000 Total Assets $207,000,000 $176,064,000 Accounts Payable 36,223,000 32,589,000 Short/Current Long Term Debt Other Current Liabilities 7,435,000 5,953,000 Total Current Liabilities $ 43,658,000 $ 38,542,000 Long Term Debt 16,960,000 Other Liabilities 20,208,000 16,664,000 Deferred Long Term Liability Charges 2,625,000 2.648.000 Total Liabilities $ 83,451,000 $ 57,854,000 Common Stock 19,764,000 16,422,000 Retained Earnings 104,256,000 101,289,000 Treasury Stock Capital Surplus Other Stockholder Equity (471,000) 499,000 Total Stockholder Equity $123,549,000 $118,210,000 Total Liabilities and Stockholders' Equity $207,000,000 $176,064,000 Income Statement Total Revenue $170,910,000 $156,508,000 Cost of Revenue 106,606,000 87,846,000 Gross Profit $ 64,304,000 $ 68,662,000 Research Development 4,475,000 3,381,000 Selling General and Administrative 10,830,000 10.040,000 Operating Income or Loss $ 48,999,000 $55,241,000 Total Other Income/Expenses Net 1,156,000 522,000 Earnings Before Interest And Taxes 50,155,000 55,763,000 Interest Expense Income Before Tax 50,155,000 55,763,000 Income Tax Expense 13,118,000 14,030,000 Operating Income or Loss $ 48,999,000 $55,241,000 Total Other Income/Expenses Net 1,156,000 522,000 Earnings Before Interest And Taxes 50,155,000 55,763,000 Interest Expense Income Before Tax 50,155,000 55,763,000 Income Tax Expense 13,118,000 14,030,000 Minority Interest Net Income From Continuing Ops 37,037,000 41,733,000 Net Income $ 37,037,000 $41,733,000 Preferred Stock And Other Adjustments Net Income Applicable To Common Shares $ 37,037,000 $41,733,000 Table shows financial statements for Apple Computer Corporation. The closing stock price for Apple was $68.11 on September 30, 2013. The average number of outstanding shares was 6.03 billion. On the basis of the financial data presented, compute the various financial ratios and make an informed analysis of Apple's financial health. (a) Debt ratio (b) Times-interest-earned ratio (c) Current ratio (d) Quick (acid-test) ratio (e) Inventory-turnover ratio (f) Day's-sales-outstanding (g) Total-assets-turnover ratio (h) Profit margin on sales (i) Return on total assets G) Return on common equity (k) Pricelearnings ratio (1) Book value per share Table THE BALANCE SHEET STATEMENT Period Ending Sep 28,2013 Sep 29, 2012 Cash And Cash Equivalents $ 14,259,000 $ 10,746,000 Short Term Investments 26,287.000 18,383,000 Net Receivables 24,094,000 21,275,000 Inventory 1,764,000 791,000 Other Current Assets 6,882,000 6,458,000 Total Current Assets $ 73,286,000 $ 57,653,000 Long Term Investments 106,215,000 92,122,000 Property Plant and Equipment 16,597,000 15,452,000 Goodwill 1,577,000 1,135,000 Intangible Assets 4,179,000 4.224,000 Other Assets 5,146,000 5,478,000 Total Assets $207,000,000 $176,064,000 Accounts Payable 36,223,000 32,589,000 Short/Current Long Term Debt Other Current Liabilities 7,435,000 5,953,000 Total Current Liabilities $ 43,658,000 $ 38,542,000 Long Term Debt 16,960,000 Other Liabilities 20,208,000 16,664,000 Deferred Long Term Liability Charges 2,625,000 2.648.000 Total Liabilities $ 83,451,000 $ 57,854,000 Common Stock 19,764,000 16,422,000 Retained Earnings 104,256,000 101,289,000 Treasury Stock Capital Surplus Other Stockholder Equity (471,000) 499,000 Total Stockholder Equity $123,549,000 $118,210,000 Total Liabilities and Stockholders' Equity $207,000,000 $176,064,000 Income Statement Total Revenue $170,910,000 $156,508,000 Cost of Revenue 106,606,000 87,846,000 Gross Profit $ 64,304,000 $ 68,662,000 Research Development 4,475,000 3,381,000 Selling General and Administrative 10,830,000 10.040,000 Operating Income or Loss $ 48,999,000 $55,241,000 Total Other Income/Expenses Net 1,156,000 522,000 Earnings Before Interest And Taxes 50,155,000 55,763,000 Interest Expense Income Before Tax 50,155,000 55,763,000 Income Tax Expense 13,118,000 14,030,000 Operating Income or Loss $ 48,999,000 $55,241,000 Total Other Income/Expenses Net 1,156,000 522,000 Earnings Before Interest And Taxes 50,155,000 55,763,000 Interest Expense Income Before Tax 50,155,000 55,763,000 Income Tax Expense 13,118,000 14,030,000 Minority Interest Net Income From Continuing Ops 37,037,000 41,733,000 Net Income $ 37,037,000 $41,733,000 Preferred Stock And Other Adjustments Net Income Applicable To Common Shares $ 37,037,000 $41,733,000 Table shows financial statements for Apple Computer Corporation. The closing stock price for Apple was $68.11 on September 30, 2013. The average number of outstanding shares was 6.03 billion. On the basis of the financial data presented, compute the various financial ratios and make an informed analysis of Apple's financial health. (a) Debt ratio (b) Times-interest-earned ratio (c) Current ratio (d) Quick (acid-test) ratio (e) Inventory-turnover ratio (f) Day's-sales-outstanding (g) Total-assets-turnover ratio (h) Profit margin on sales (i) Return on total assets G) Return on common equity (k) Pricelearnings ratio (1) Book value per share Table THE BALANCE SHEET STATEMENT Period Ending Sep 28,2013 Sep 29, 2012 Cash And Cash Equivalents $ 14,259,000 $ 10,746,000 Short Term Investments 26,287.000 18,383,000 Net Receivables 24,094,000 21,275,000 Inventory 1,764,000 791,000 Other Current Assets 6,882,000 6,458,000 Total Current Assets $ 73,286,000 $ 57,653,000 Long Term Investments 106,215,000 92,122,000 Property Plant and Equipment 16,597,000 15,452,000 Goodwill 1,577,000 1,135,000 Intangible Assets 4,179,000 4.224,000 Other Assets 5,146,000 5,478,000 Total Assets $207,000,000 $176,064,000 Accounts Payable 36,223,000 32,589,000 Short/Current Long Term Debt Other Current Liabilities 7,435,000 5,953,000 Total Current Liabilities $ 43,658,000 $ 38,542,000 Long Term Debt 16,960,000 Other Liabilities 20,208,000 16,664,000 Deferred Long Term Liability Charges 2,625,000 2.648.000 Total Liabilities $ 83,451,000 $ 57,854,000 Common Stock 19,764,000 16,422,000 Retained Earnings 104,256,000 101,289,000 Treasury Stock Capital Surplus Other Stockholder Equity (471,000) 499,000 Total Stockholder Equity $123,549,000 $118,210,000 Total Liabilities and Stockholders' Equity $207,000,000 $176,064,000 Income Statement Total Revenue $170,910,000 $156,508,000 Cost of Revenue 106,606,000 87,846,000 Gross Profit $ 64,304,000 $ 68,662,000 Research Development 4,475,000 3,381,000 Selling General and Administrative 10,830,000 10.040,000 Operating Income or Loss $ 48,999,000 $55,241,000 Total Other Income/Expenses Net 1,156,000 522,000 Earnings Before Interest And Taxes 50,155,000 55,763,000 Interest Expense Income Before Tax 50,155,000 55,763,000 Income Tax Expense 13,118,000 14,030,000 Operating Income or Loss $ 48,999,000 $55,241,000 Total Other Income/Expenses Net 1,156,000 522,000 Earnings Before Interest And Taxes 50,155,000 55,763,000 Interest Expense Income Before Tax 50,155,000 55,763,000 Income Tax Expense 13,118,000 14,030,000 Minority Interest Net Income From Continuing Ops 37,037,000 41,733,000 Net Income $ 37,037,000 $41,733,000 Preferred Stock And Other Adjustments Net Income Applicable To Common Shares $ 37,037,000 $41,733,000
Expert Answer:
Answer rating: 100% (QA)
Ans Apple Computer Corporation Calculation of various financial ratios and making an informed analysis of Apples financial health a Debt ratio Total Debt Total Assets Total longterm Liabilities Total ... View the full answer

Related Book For 

Posted Date:
Students also viewed these accounting questions
-
Table P2.4 shows financial statements for Apple Computer Corporation. The closing stock price ofr Apple was $128.24 on September 26,2008. The average number of outstanding shares was 982.11 million....
-
The following data represent the closing stock price for Google, Inc. at the end of each year since it ï¬rst went public in 2004 until the end of 2010. Construct a time-series plot and...
-
The closing stock price for each of two stocks was recorded over a 12-month period. The closing price for the Dow Jones Industrial Average (DJIA) was also recorded over this same time period. These...
-
1. What is differences between the ancient Mayan criminal justice system and modern criminal justice systems? 2. Does the legal system of the ancient Maya has any relevance to the modern world? File...
-
The data from Exercise 3.26 were entered into a MINITAB worksheet, and the following output was obtained. Exercise 3.26 How much money do movies make on a single weekend? Does this amount in any way...
-
In the previous problem, what would the ROE on the investment have to be if we wanted the price after the offering to be $71 per share? Assume the PE ratio remains constant. What is the NPV of this...
-
Explain that in a CAPM framework, the projection price of a new asset is a universal zero-level price for all mean-variance investors.
-
Jason and Mary are married taxpayers in 2016. They are both under age 65 and in good health. For this tax year, they have a total of $41,000 in wages and $700 in interest income. Jason and Mary's...
-
Set up an iterated triple integral in the order dxdzdy that gives the volume of the solid in the first octant enclosed by the xz-plane, the plane 2x + y +2z = 8, and the parabolic cylinder y = x. Do...
-
Three different analytical methods are compared for determining Ca in a biological sample. The laboratory is interested in knowing whether the methods differ. The results shown below represent Ca...
-
Suppose you have decided to start a business producing and selling a product of your choice from the following options: custom birthday cakes, lawn mowers or sports jackets. For your essay, answer...
-
In Problems 11-18, find the three measures of central tendency (the mean, median, and mode). \(79,90,95,95,96 \)
-
What is a least squares line?
-
Prepare a frequency distribution for each data set in Problems 24-27. Consider the following data sets: Data set \(C\) Data set A: The annual wages of employees at a small accounting firm are given...
-
Highlight the key items in the balance sheet of an Islamic bank.
-
Decide whether something is wrong with each of the graphs shown in Problems 13-17. Explain your reasoning. Consider the graph shown in Figure 14.21. The potential commercial forest growth, as...
-
What is the cosine equation of the function shown? FEIN 3 2 -1 1 -2 -52 379 5 for -5 -7 -8 -9 -10 -11 -12 Enter your answer by filling in the boxes. Enter any phase shift as its smallest multiple...
-
Does log 81 (2401) = log 3 (7)? Verify the claim algebraically.
-
What is random sampling? Why is it necessary for a sample to be obtained randomly rather than conveniently? Will randomness guarantee that a sample will provide accurate information about the...
-
According to a study done by Nick Wilson of Otago University Wellington, the probability a randomly selected individual will not cover his or her mouth when sneezing is 0.267. Suppose you sit on a...
-
According to the U.S. Census Bureau, in 2009, 2.1% of Americans worked at home. An economist believes that the percentage of Americans working at home has increased since then. He randomly selects...
-
What methods can a company use to raise capital?
-
Does higher expected inflation increase, decrease, or have no effect on the required rate of return?
-
What are some of the advantages of equity financing?

Study smarter with the SolutionInn App