

Question: Table Q 1 . presents S O 2 solubility data in pure water at 3 0 3 K and 1 0 1 . 3 kPa,
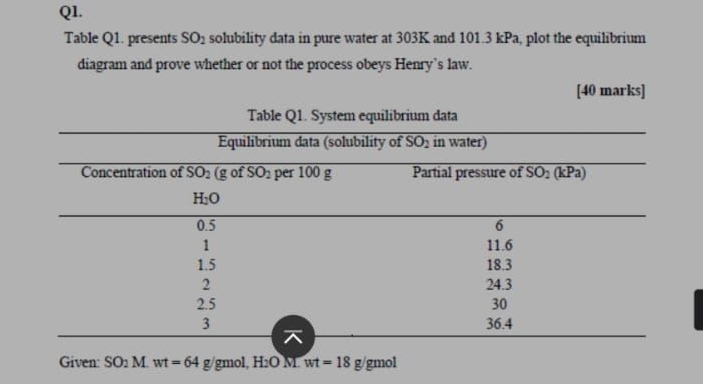
Table Q presents solubility data in pure water at and kPa, plot the equilibrium diagram and prove whether or not the process obeys Henry's law.
marks
Table Q System equilibrium data
tableEquilibrium data solubility of in waterConcentration of of per Partial pressure of
Q
Table Q presents solubility data in pure water at and kPa, plot the equilibrium diagram and prove whether or not the process obeys Henry's law.
marks
Table Q System equilibrium data
tableEquilibrium data solubility of in waterConcentration of of per Partial pressure of
Step by Step Solution
There are 3 Steps involved in it
1 Expert Approved Answer
Step: 1 Unlock

Question Has Been Solved by an Expert!
Get step-by-step solutions from verified subject matter experts
Step: 2 Unlock
Step: 3 Unlock