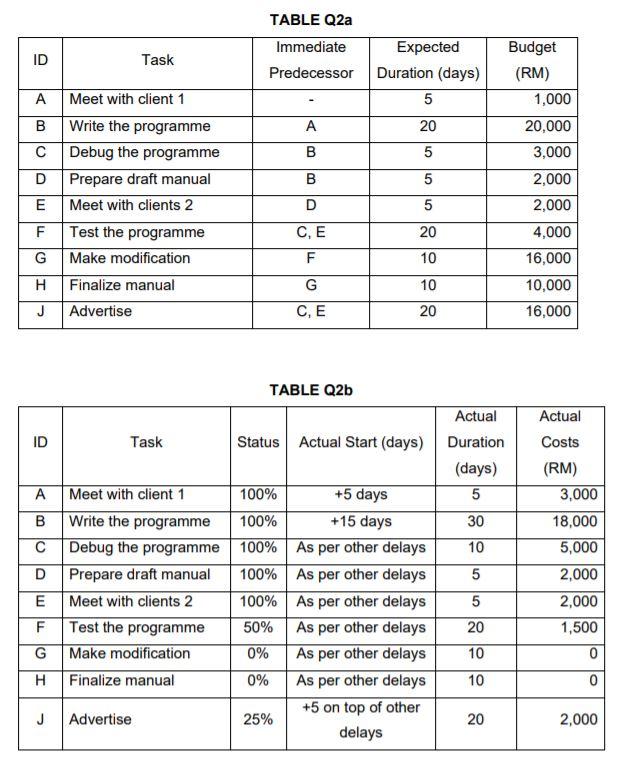
Question: TABLE Q2a Immediate Predecessor ID Task Expected Duration (days) 5 A B A 20 B 5 Budget (RM) 1,000 20,000 3,000 2,000 2,000 4,000 16,000

TABLE Q2a Immediate Predecessor ID Task ExpectedTABLE Q2a Immediate Predecessor ID Task Expected

TABLE Q2a Immediate Predecessor ID Task Expected Duration (days) 5 A B A 20 B 5 Budget (RM) 1,000 20,000 3,000 2,000 2,000 4,000 16,000 D B 5 E Meet with client 1 Write the programme Debug the programme Prepare draft manual Meet with clients 2 Test the programme Make modification Finalize manual Advertise D 5 | | 20 F G H CE F G CE 10 10 20 10,000 J 16,000 TABLE Q2b ID Task Status Actual Start (days) Actual Duration (days) 5 A C 10 Actual Costs (RM) 3,000 18,000 5,000 2,000 2,000 1,500 0 0 D 5 E 5 Meet with client 1 100% +5 days Write the programme 100% +15 days Debug the programme 100% As per other delays Prepare draft manual 100% As per other delays Meet with clients 2 100% As per other delays Test the programme 50% As per other delays Make modification 0% As per other delays Finalize manual 0% As per other delays +5 on top of other Advertise 25% delays F 20 IQ Tm G 10 10 J 20 2,000 b. It is now Week 13 of the project. The performance of the project is as summarized in TABLE Q2b. Report the progress of the project as at Week 13 using a Gantt Chart. Perform an analysis of the project status at Week 13 by using EVA. Use the CPI and SPI to determine project efficiency. Estimate the performance of the project at completion and propose suitable steps to enhance the overall performance. [30 marks) TABLE Q2a Immediate Predecessor ID Task Expected Duration (days) 5 A B A 20 B 5 Budget (RM) 1,000 20,000 3,000 2,000 2,000 4,000 16,000 D B 5 E Meet with client 1 Write the programme Debug the programme Prepare draft manual Meet with clients 2 Test the programme Make modification Finalize manual Advertise D 5 | | 20 F G H CE F G CE 10 10 20 10,000 J 16,000 TABLE Q2b ID Task Status Actual Start (days) Actual Duration (days) 5 A C 10 Actual Costs (RM) 3,000 18,000 5,000 2,000 2,000 1,500 0 0 D 5 E 5 Meet with client 1 100% +5 days Write the programme 100% +15 days Debug the programme 100% As per other delays Prepare draft manual 100% As per other delays Meet with clients 2 100% As per other delays Test the programme 50% As per other delays Make modification 0% As per other delays Finalize manual 0% As per other delays +5 on top of other Advertise 25% delays F 20 IQ Tm G 10 10 J 20 2,000 b. It is now Week 13 of the project. The performance of the project is as summarized in TABLE Q2b. Report the progress of the project as at Week 13 using a Gantt Chart. Perform an analysis of the project status at Week 13 by using EVA. Use the CPI and SPI to determine project efficiency. Estimate the performance of the project at completion and propose suitable steps to enhance the overall performance. [30 marks)

Step by Step Solution

There are 3 Steps involved in it

1 Expert Approved Answer
Step: 1 Unlock blur-text-image
Question Has Been Solved by an Expert!

Get step-by-step solutions from verified subject matter experts

Step: 2 Unlock
Step: 3 Unlock

Students Have Also Explored These Related General Management Questions!