

Question: Table represents data collected in a pilot simulation run of a model. Table Data collected from a simulation run with 5 replications (i) Use the
Table represents data collected in a pilot simulation run of a model.
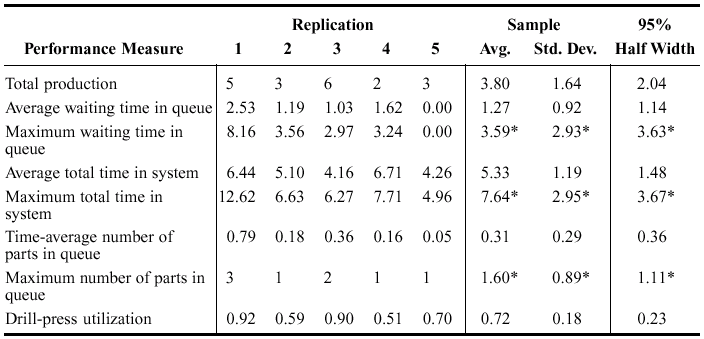
Table Data collected from a simulation run with 5 replications
- (i) Use the data in Table 2 to calculate the confidence interval for the time average number of parts in the queue.
- Comment on your results in (a) (i)
Sample 95% Avg. Std. Dev. Half Width 3.80 1.27 3.59* 1.64 0.92 2.93* 2.04 1.14 3.63* Replication Performance Measure 1 2 3 4 5 Total production 5 3 6 2 3 Average waiting time in queue 2.53 1.19 1.03 1.62 0.00 Maximum waiting time in 8.16 3.56 2.97 3.24 0.00 queue Average total time in system 6.44 5.10 4.16 6.71 4.26 Maximum total time in 12.62 6.63 6.27 7.71 4.96 system Time-average number of 0.79 0.18 0.36 0.16 0.05 parts in queue Maximum number of parts in 3 1 2 1 1 queue Drill-press utilization 0.92 0.59 0.90 0.51 0.70 5.33 7.64" 1.19 2.95* 1.48 3.67* 0.31 0.29 0.36 1.60* 0.89* 1.11* 0.72 0.18 0.23 Sample 95% Avg. Std. Dev. Half Width 3.80 1.27 3.59* 1.64 0.92 2.93* 2.04 1.14 3.63* Replication Performance Measure 1 2 3 4 5 Total production 5 3 6 2 3 Average waiting time in queue 2.53 1.19 1.03 1.62 0.00 Maximum waiting time in 8.16 3.56 2.97 3.24 0.00 queue Average total time in system 6.44 5.10 4.16 6.71 4.26 Maximum total time in 12.62 6.63 6.27 7.71 4.96 system Time-average number of 0.79 0.18 0.36 0.16 0.05 parts in queue Maximum number of parts in 3 1 2 1 1 queue Drill-press utilization 0.92 0.59 0.90 0.51 0.70 5.33 7.64" 1.19 2.95* 1.48 3.67* 0.31 0.29 0.36 1.60* 0.89* 1.11* 0.72 0.18 0.23
Step by Step Solution
There are 3 Steps involved in it

Get step-by-step solutions from verified subject matter experts