

Question: Question 2 Table 2 represents data collected in a position of a model Tahle 2-Data collected from a simulation with replication Mas (a) Une the
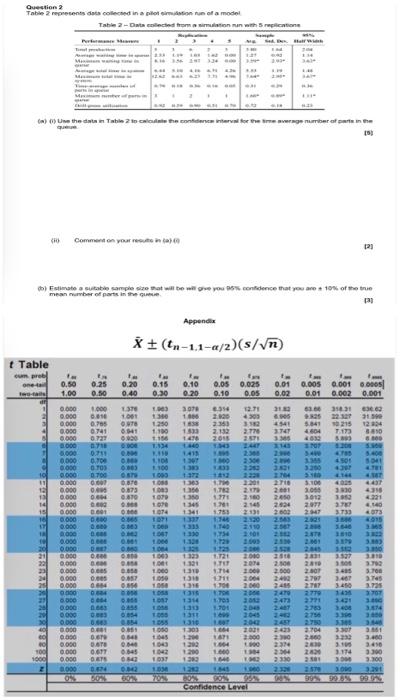
Question 2 Table 2 represents data collected in a position of a model Tahle 2-Data collected from a simulation with replication Mas (a) Une the data Table 2 totodate the condamnere for the generate in the 15 Comment on your inta 121 olimato a suitable sample size at will be will you confidence that you are 10% of the the mean number of parts in the unce led Appendix X (n-1.1-a/2)(s) t Table cumpre 0.50 1.00 0.15 0.25 0.50 0.20 0.40 0.10 0.20 ta 0.05 0.10 0.025 0.05 1.000 3 3 1001 OTO 3070 1 0.76 0.000 0.000 0.000 0.000 0.000 0.000 6.000 1.00 30 120 1.100 1156 1.134 40 31 0.01 0.005 0.001 0.0005 0.02 0.01 0.002 0.001 31 63.66 30 31 6.00 31 454 5.84 1204 NY 464 7.13 3 8.800 1333 2360 2132 2015 ORE 25 CE DIE 140 1415 13 13 2.500 0 000 108 100 4501 0.003 OS 20 3200 It 0.70 0.709 OTOS 700 000 0. 0. LE E 10 10 100 0.875 0.870 . 1.7 1.175 1383 36 30 1345 1341 2.300 2. 2160 2148 2001 2.650 3.10 3.000 3.012 3 TOTO 10 11014 30 39 1 14 15 18 4318 4321 1.75 3733 2600 20 16 2593 0.601 D. 0.60 . E 015 CRO ter 2110 0.000 0.000 67000 0.000 0.000 0.000 0.000 0.000 1000 0:00 0.000 0.000 0.000 0.000 0.000 0.000 0.000 0.000 3.000 0.000 0.000 10 754 3.720 . 3 20 22 CEL 3527 104 10 1.00 1.000 100 2010 20 . 0.65 0.01 0. 06 . GINE 1.121 UTE SH 11 100 798 2.300 2.000 242 HCE 2004 2000 3.450 . 145 3.725 3707 04 0.000 30 2470 2472 2 27 2771 2789 SIC MEI CIEL 115 CE 20 POR 3.614 10 1.701 1 . . 0. 31 0.854 1303 2:42 200 3 361 3.400 3307 12 tes 2704 2.000 16 20 000 0000 0.000 0.000 0.000 0.000 3.000 0.6 DATO 0.617 DETS od 1000 . 0.845 102 TO 1200 1600 132 140 24 2330 3174 30 3.300 3.100 2291 2 0.00 00 Confidence Level Question 2 Table 2 represents data collected in a position of a model Tahle 2-Data collected from a simulation with replication Mas (a) Une the data Table 2 totodate the condamnere for the generate in the 15 Comment on your inta 121 olimato a suitable sample size at will be will you confidence that you are 10% of the the mean number of parts in the unce led Appendix X (n-1.1-a/2)(s) t Table cumpre 0.50 1.00 0.15 0.25 0.50 0.20 0.40 0.10 0.20 ta 0.05 0.10 0.025 0.05 1.000 3 3 1001 OTO 3070 1 0.76 0.000 0.000 0.000 0.000 0.000 0.000 6.000 1.00 30 120 1.100 1156 1.134 40 31 0.01 0.005 0.001 0.0005 0.02 0.01 0.002 0.001 31 63.66 30 31 6.00 31 454 5.84 1204 NY 464 7.13 3 8.800 1333 2360 2132 2015 ORE 25 CE DIE 140 1415 13 13 2.500 0 000 108 100 4501 0.003 OS 20 3200 It 0.70 0.709 OTOS 700 000 0. 0. LE E 10 10 100 0.875 0.870 . 1.7 1.175 1383 36 30 1345 1341 2.300 2. 2160 2148 2001 2.650 3.10 3.000 3.012 3 TOTO 10 11014 30 39 1 14 15 18 4318 4321 1.75 3733 2600 20 16 2593 0.601 D. 0.60 . E 015 CRO ter 2110 0.000 0.000 67000 0.000 0.000 0.000 0.000 0.000 1000 0:00 0.000 0.000 0.000 0.000 0.000 0.000 0.000 0.000 3.000 0.000 0.000 10 754 3.720 . 3 20 22 CEL 3527 104 10 1.00 1.000 100 2010 20 . 0.65 0.01 0. 06 . GINE 1.121 UTE SH 11 100 798 2.300 2.000 242 HCE 2004 2000 3.450 . 145 3.725 3707 04 0.000 30 2470 2472 2 27 2771 2789 SIC MEI CIEL 115 CE 20 POR 3.614 10 1.701 1 . . 0. 31 0.854 1303 2:42 200 3 361 3.400 3307 12 tes 2704 2.000 16 20 000 0000 0.000 0.000 0.000 0.000 3.000 0.6 DATO 0.617 DETS od 1000 . 0.845 102 TO 1200 1600 132 140 24 2330 3174 30 3.300 3.100 2291 2 0.00 00 Confidence Level
Step by Step Solution
There are 3 Steps involved in it
To solve this problem well go through the steps for calculating the confidence interval and estimati... View full answer

Get step-by-step solutions from verified subject matter experts