

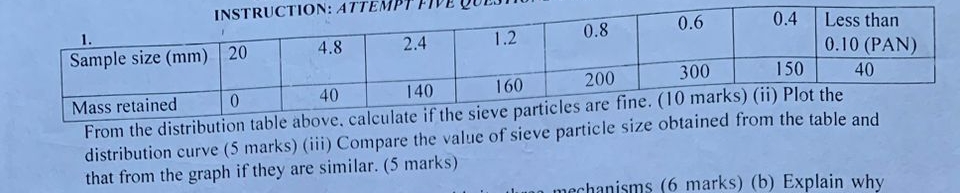
Question: table [ [ Sample size ( mm ) , 2 0 , 4 . 8 , 2 . 4 , 1 . 2 ,
tableSample size mmtableLess thanPANMass retained,
From the distribution table above, calculate if the sieve particles are fine. marksii Plot the distribution curve marksiii Compare the value of sieve particle size obtained from the table and that from the graph if they are similar. marks
Step by Step Solution
There are 3 Steps involved in it
1 Expert Approved Answer
Step: 1 Unlock

Question Has Been Solved by an Expert!
Get step-by-step solutions from verified subject matter experts
Step: 2 Unlock
Step: 3 Unlock