

Question: table [ [ Sample Sute, n , Mean Factor. A 2 , Upper Range. t , Lower Range. D , ] , [ 2
tableSample Sute, Mean Factor. Upper Range. Lower Range. Ddsttaxe,EFTt,
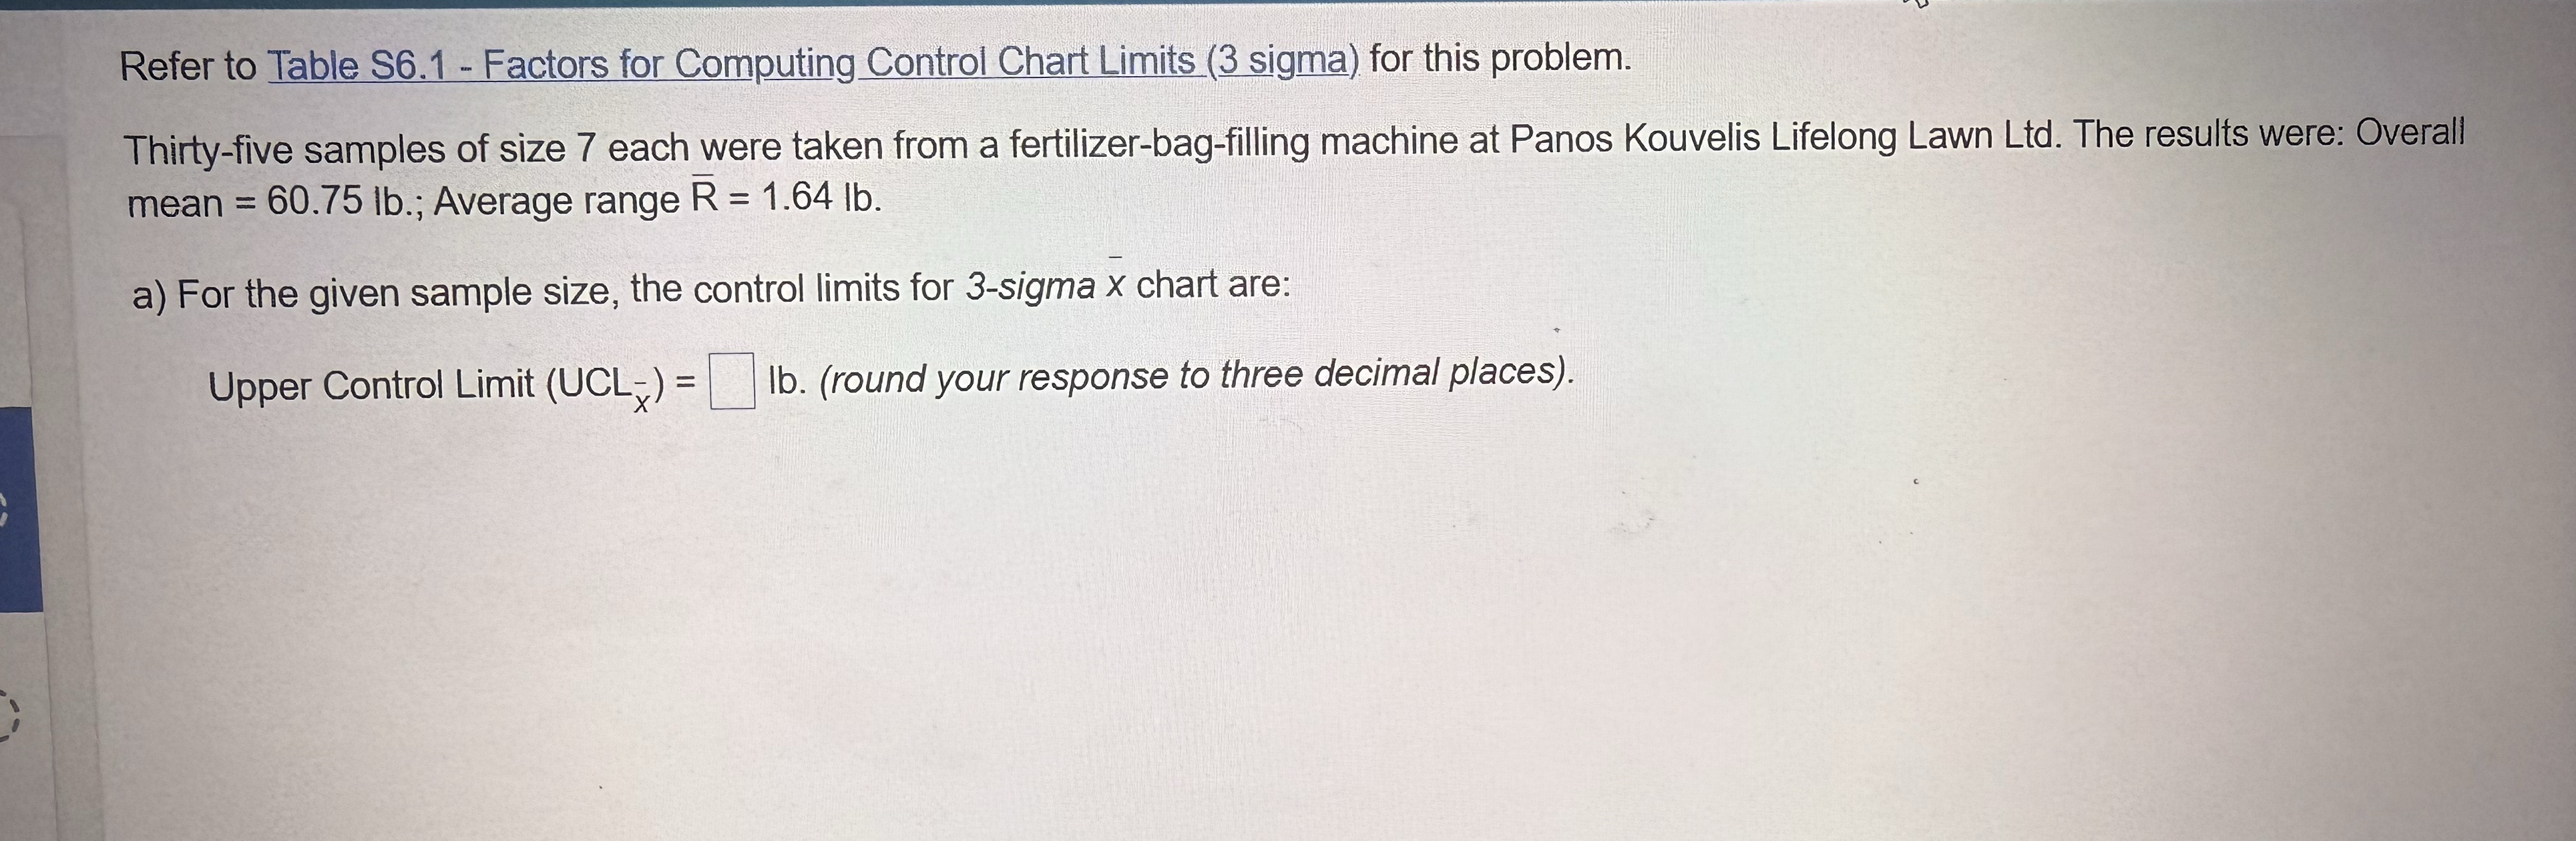
Refer to Table S Factors for Computing Control Chart Limits sigma for this problem.
Thirtyfive samples of size each were taken from a fertilizerbagfilling machine at Panos Kouvelis Lifelong Lawn Ltd The results were: Overall mean ; Average range
a For the given sample size, the control limits for sigma chart are:
Upper Control Limit lbround your response to three decimal places
What is the mean factor
What is the Upper range
What is the lower range
What is the Control Limits for sigma x chart
What is the control limits for sigma R chart
Step by Step Solution
There are 3 Steps involved in it
1 Expert Approved Answer
Step: 1 Unlock

Question Has Been Solved by an Expert!
Get step-by-step solutions from verified subject matter experts
Step: 2 Unlock
Step: 3 Unlock