

Question: Table shows a different random sampling of 2 0 cell phone models. Use this data to calculate a 9 5 % confidence interval for the
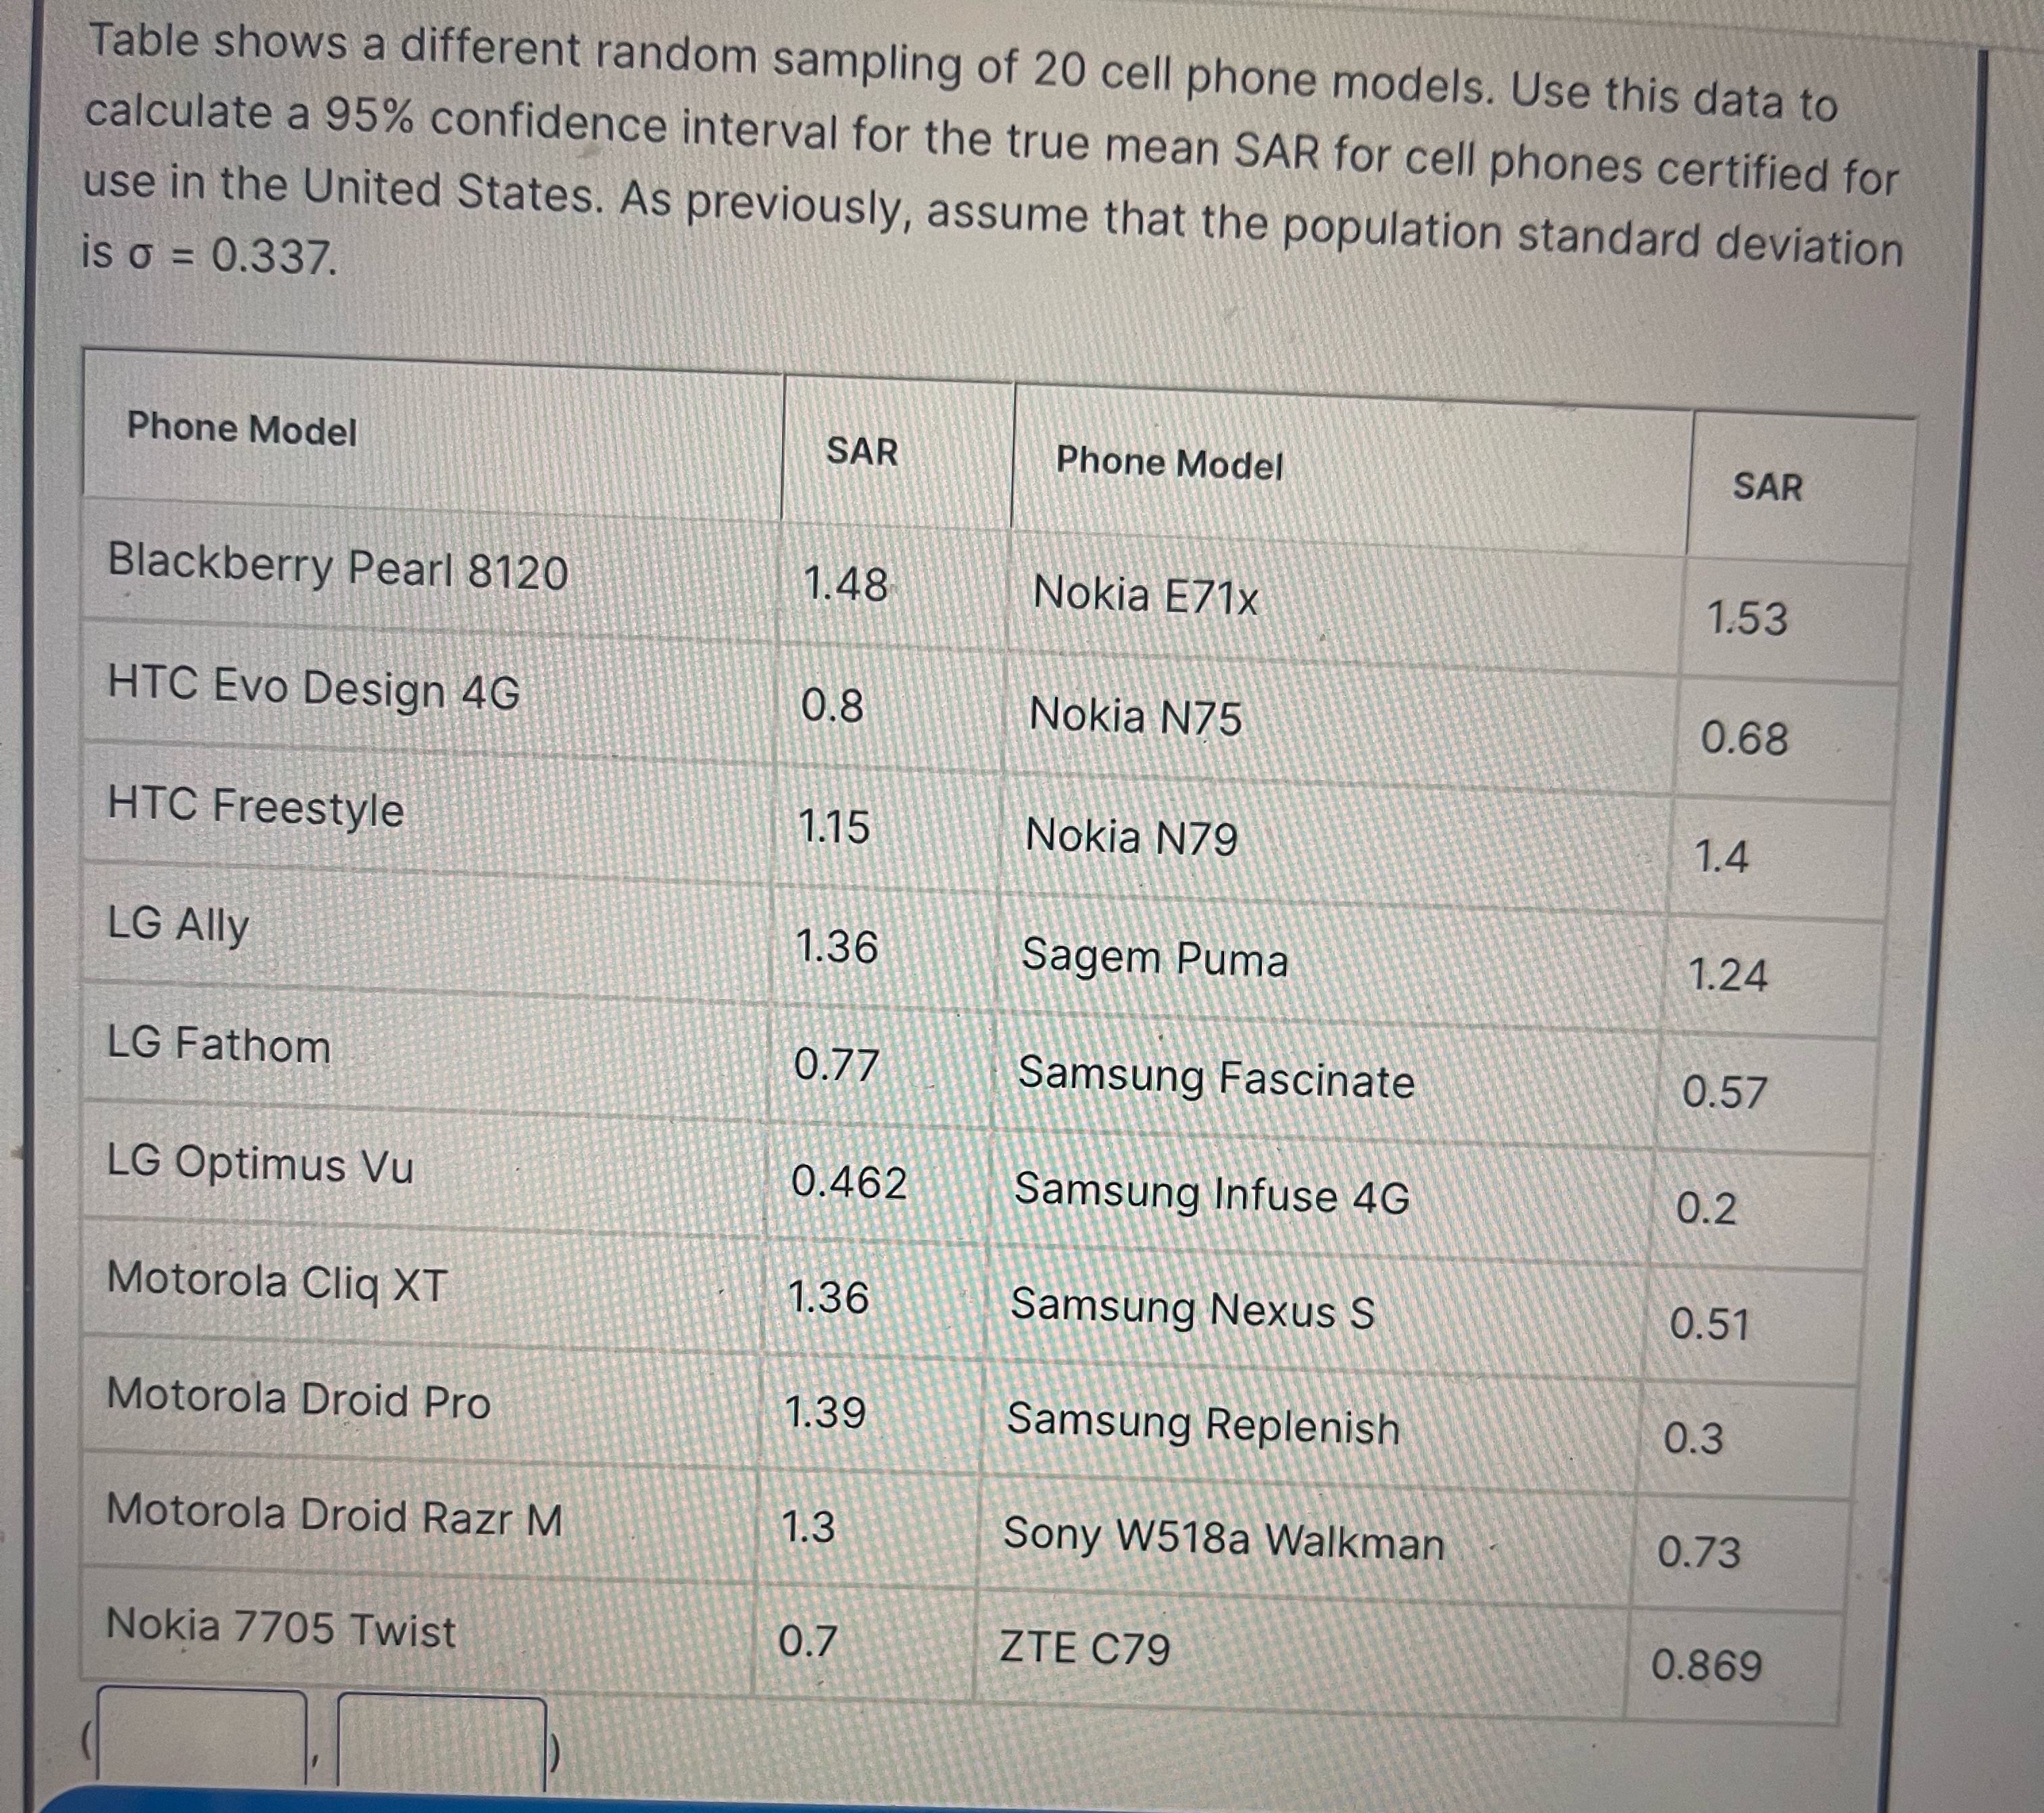
Table shows a different random sampling of cell phone models. Use this data to calculate a confidence interval for the true mean SAR for cell phones certified for use in the United States. As previously, assume that the population standard deviation is
tablePhone Model,SAR,Phone Model,SARBlackberry Pearl Nokia EXHTC Evo Design GNokia NHTC Freestyle,Nokia NLG Ally,Sagem Puma,LG Fathom,Samsung Fascinate,LG Optimus VuSamsung Infuse GMotorola Cliq XTSamsung Nexus SMotorola Droid Pro,Samsung Replenish,Motorola Droid Razr MSony Wa Walkman,Nokia Twist,ZTE C
Step by Step Solution
There are 3 Steps involved in it
1 Expert Approved Answer
Step: 1 Unlock

Question Has Been Solved by an Expert!
Get step-by-step solutions from verified subject matter experts
Step: 2 Unlock
Step: 3 Unlock