

Question: table [ [ UESTION 2 , table [ [ Consider the following demand figures for the 7 most recent periods ] , [
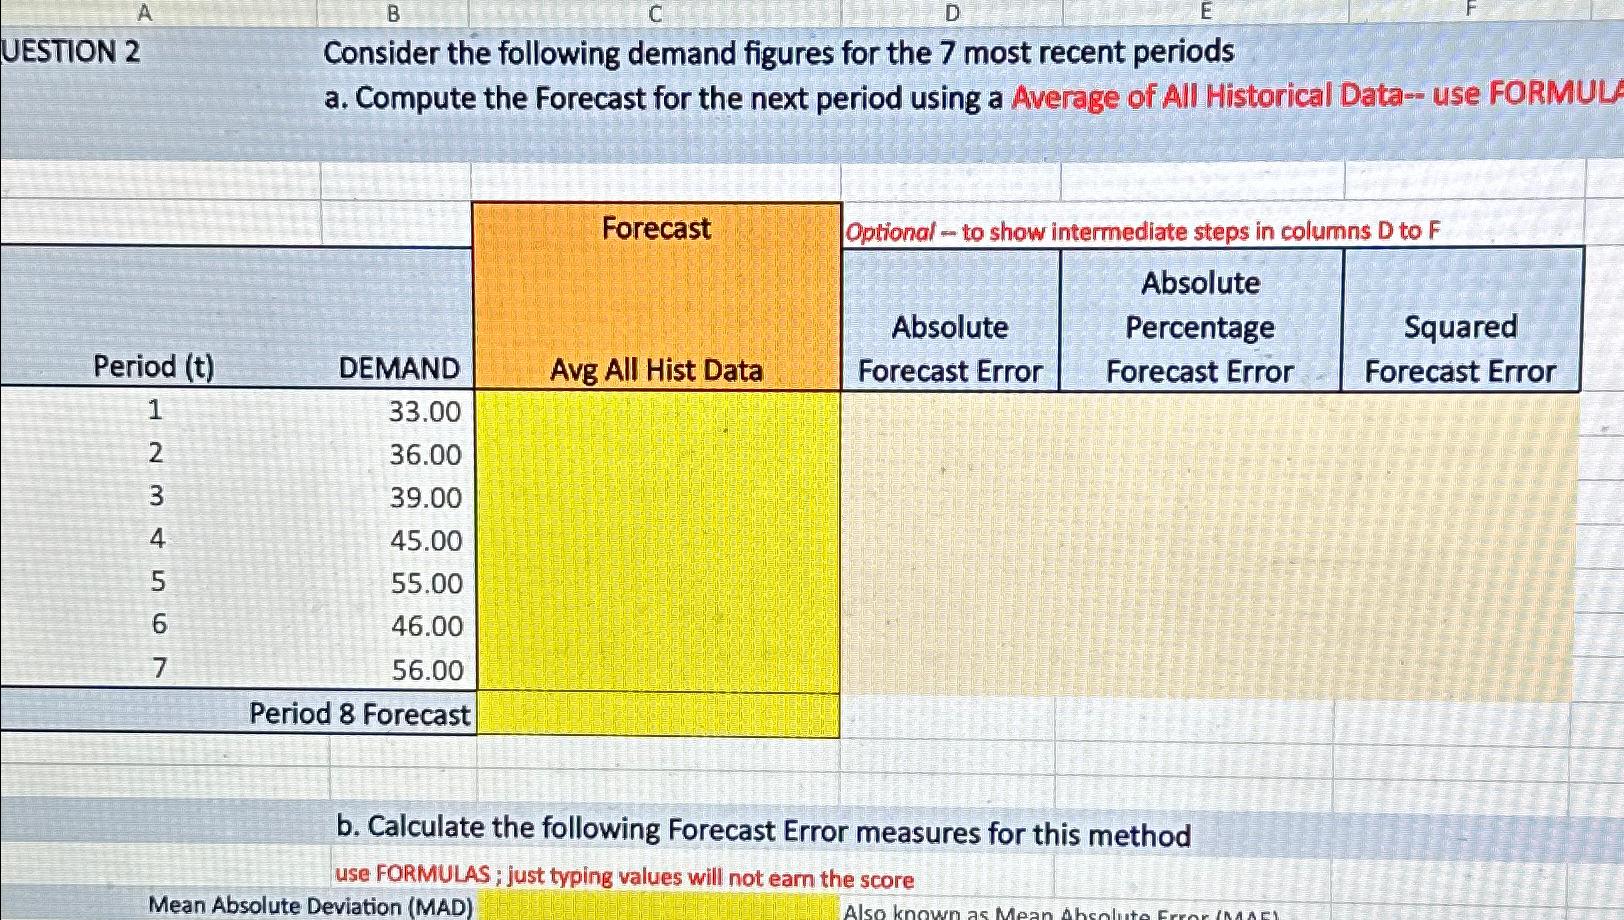
tableUESTION tableConsider the following demand figures for the most recent periodsa Compute the Forecast for the next period using a Average of All Historical Data use FORMUPeriod DEMAND,tableForecastAvg All Hist DataOptional to show intermediate steps in columns D to FtableAbsoluteForecast ErrortableAbsolutePercentageForecast ErrortableSquaredForecast Errord Forecast,,,,
b Calculate the following Forecast Error measures for this method
Use FORMULAS; just typing values will not earn the score
Mean Absolute Deviation MAD
Step by Step Solution
There are 3 Steps involved in it
1 Expert Approved Answer
Step: 1 Unlock

Question Has Been Solved by an Expert!
Get step-by-step solutions from verified subject matter experts
Step: 2 Unlock
Step: 3 Unlock