

Question: Tableau Dashboard Activity 16-1 (Static) Required information Tableau Dashboard Activity 16-1 (Static) [The following information applies to the questions displayed below.] This exercise provides a
![(Static) [The following information applies to the questions displayed below.] This exercise](https://s3.amazonaws.com/si.experts.images/answers/2024/06/667adcbe9f887_934667adcbe85f45.jpg)


Tableau Dashboard Activity 16-1 (Static)
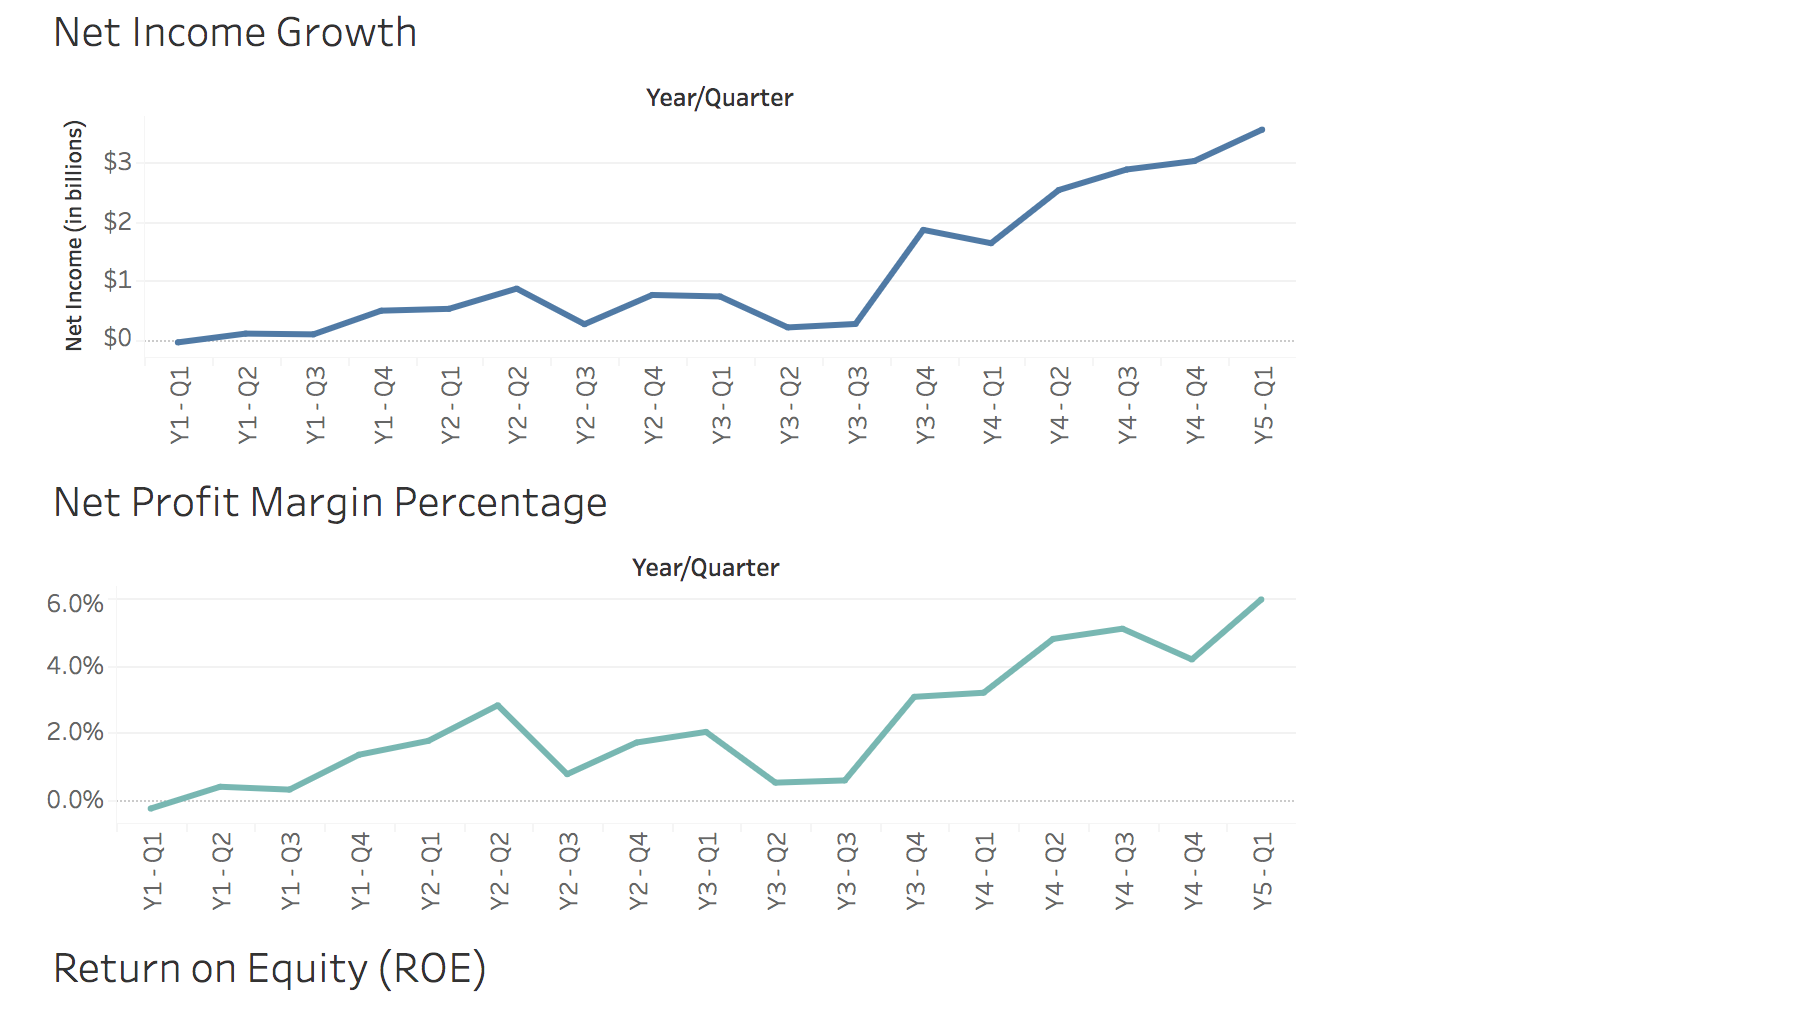

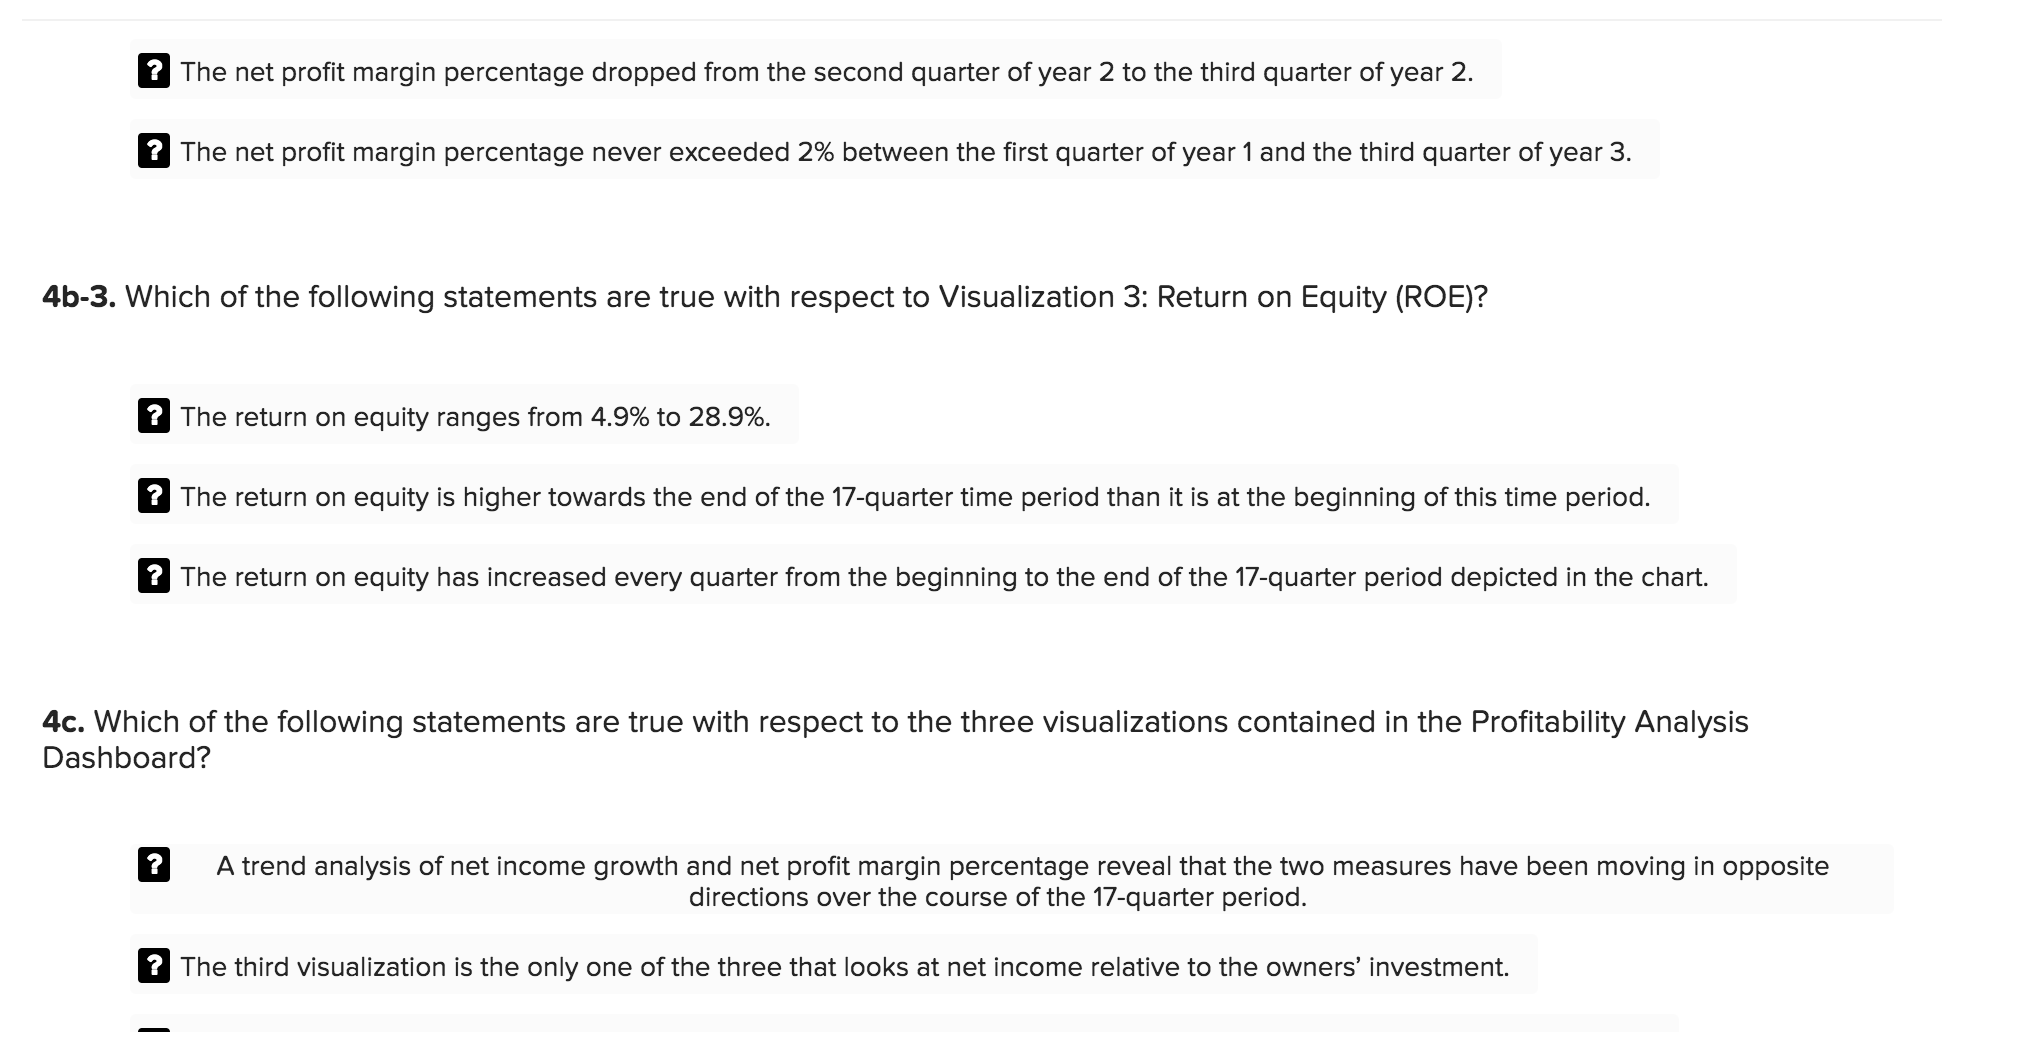

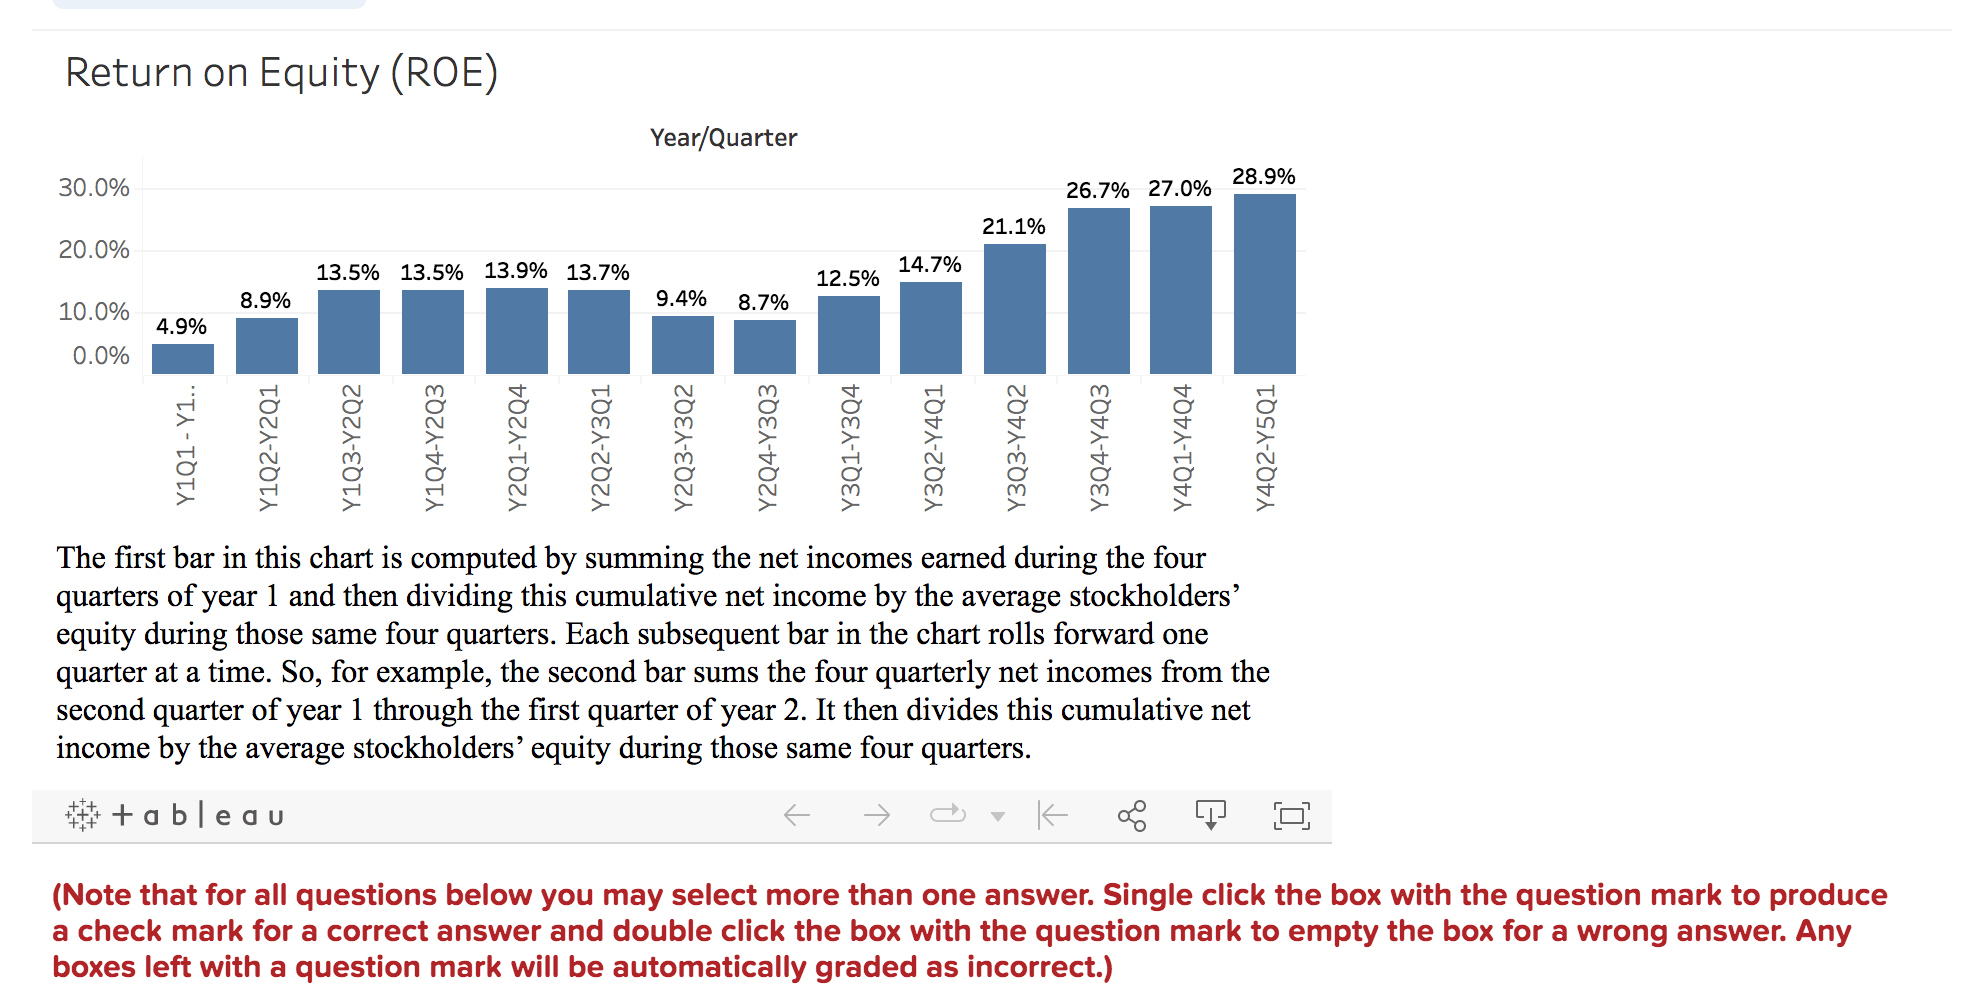
Required information Tableau Dashboard Activity 16-1 (Static) [The following information applies to the questions displayed below.] This exercise provides a total of 13 data visualizations that describe a real company's performance based on 17 quarters of financial data. The visualizations are grouped into five dashboards that were created in Tableau: (1) sales analysis, (2) gross margin analysis, (3) operating expense analysis, (4) profitability analysis, and (5) market performance analysis. Required: For each section, review the Tableau visualizations and answer the questions. Tableau Dashboard Activity 16-1 (Static) Part 4 Refer to the Profitability Analysis Dashboard below and answer the questions.Net Income (in billions) 6.0% 4.0% 2.0% 0.0% $2 $3 $0 Y1 - Q1 Y1 - Q1 Y1 - Q2 Net Income Growth Y1 - Q2 Return on Equity (ROE) Y1 - Q3 Y1 - Q3 Net Profit Margin Percentage Y1 - Q4 Y1 - Q4 Y2 - Q1 Y2 - Q1 Y2 - Q2 Y2 - Q2 Y2 - Q3 Y2 - Q3 Y2 - Q4 Y2 - Q4 Y3 - Q1 Year/Quarter Year/Quarter Y3 - Q1 Y3 - Q2 Y3 - Q2 Y3 - Q3 Y3 - Q3 Y3 - Q4 Y3 - Q4 Y4 - Q1 Y4 - Q1 Y4 - Q2 Y4 - Q2 Y4- Q3 Y4 - Q3 Y4 - Q4 Y4 - Q4 Y5 - Q1 Y5 - Q1Return on Equity (ROE) Year/Quarter 30.0% 26.7% 27.0% 283% 21.1% 20.0% 13.5% 13.5% 13.9% 117% 12.5% 14.7% 8.9% 9.4% 8.7% 100% 4.9% 00% - I : Il N m
Step by Step Solution
There are 3 Steps involved in it

Get step-by-step solutions from verified subject matter experts