

Question: Tableau Dashboard Activity 16-1 (Static) Required information Tableau Dashboard Activity 16-1 (Static) [The following information applies to the questions displayed below. ] This exercise provides
Tableau Dashboard Activity 16-1 (Static)
![[The following information applies to the questions displayed below. ] This exercise](https://s3.amazonaws.com/si.experts.images/answers/2024/06/667ff358844bc_400667ff3586ff45.jpg)
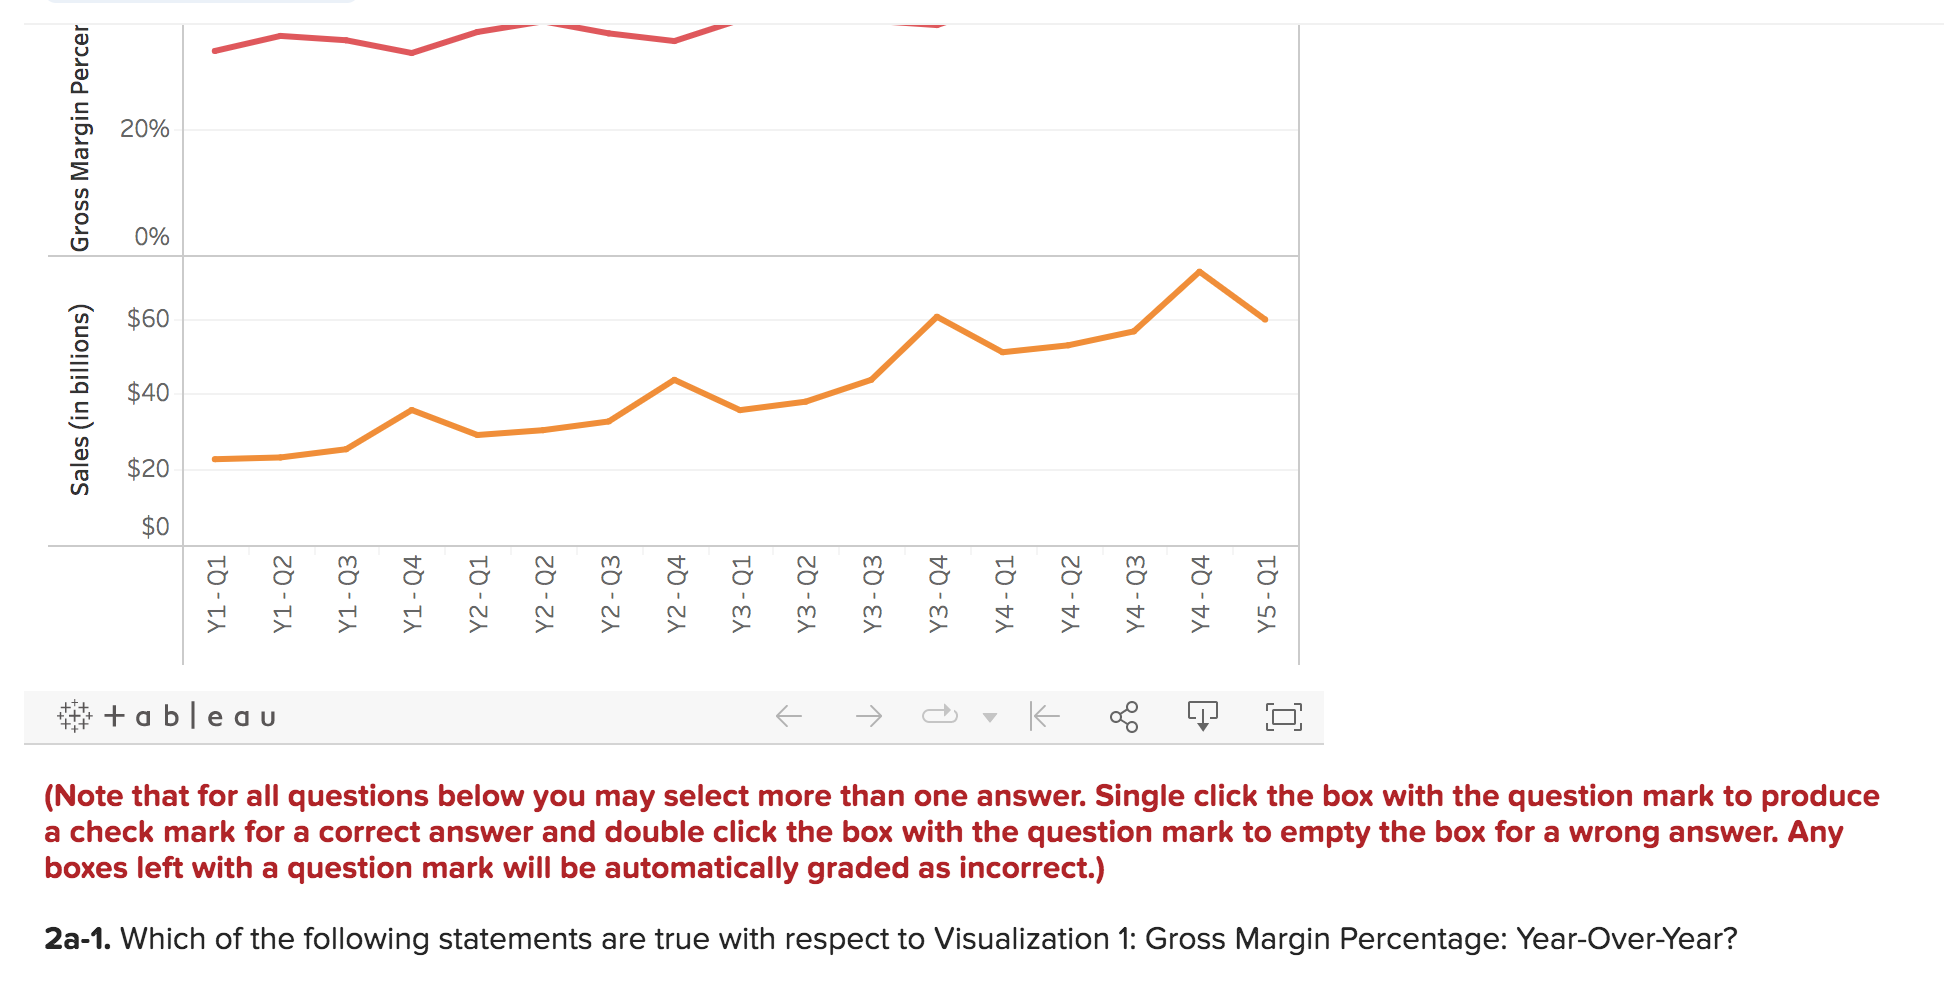
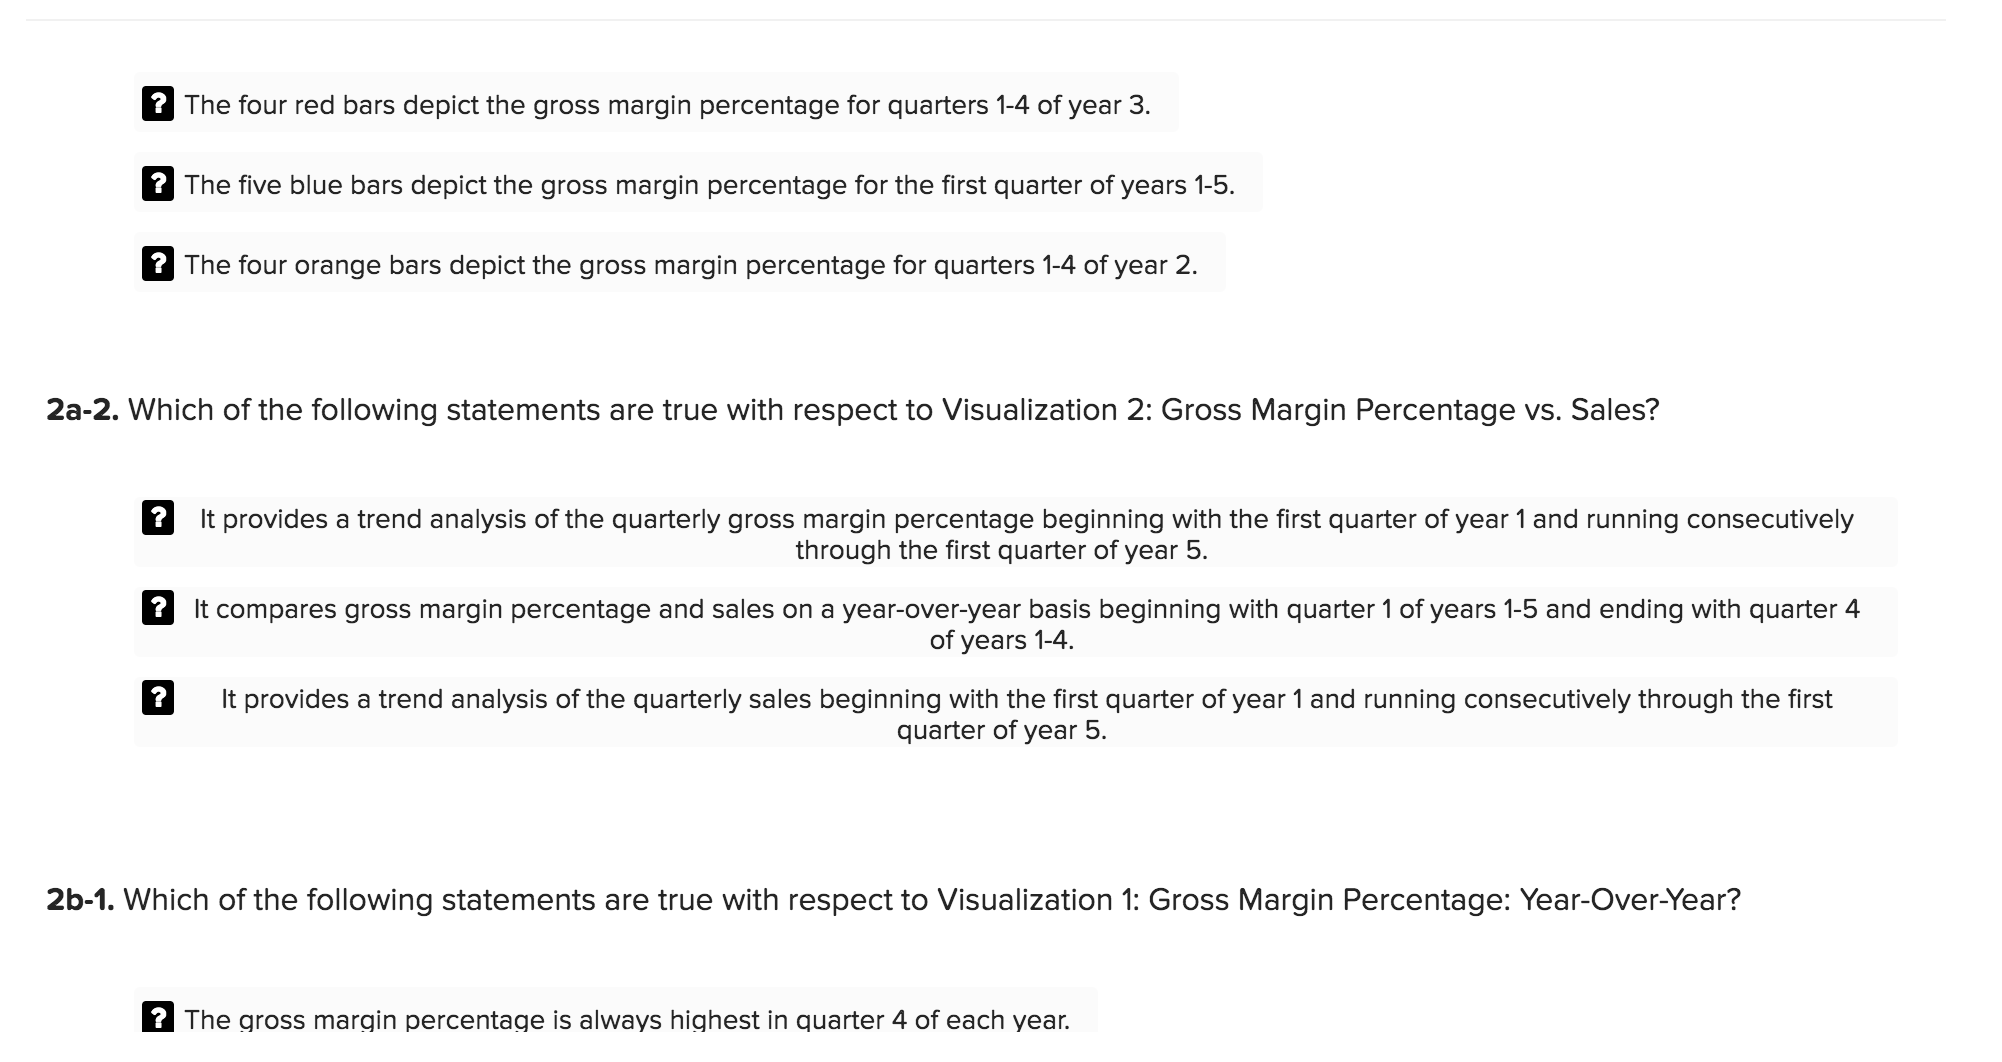
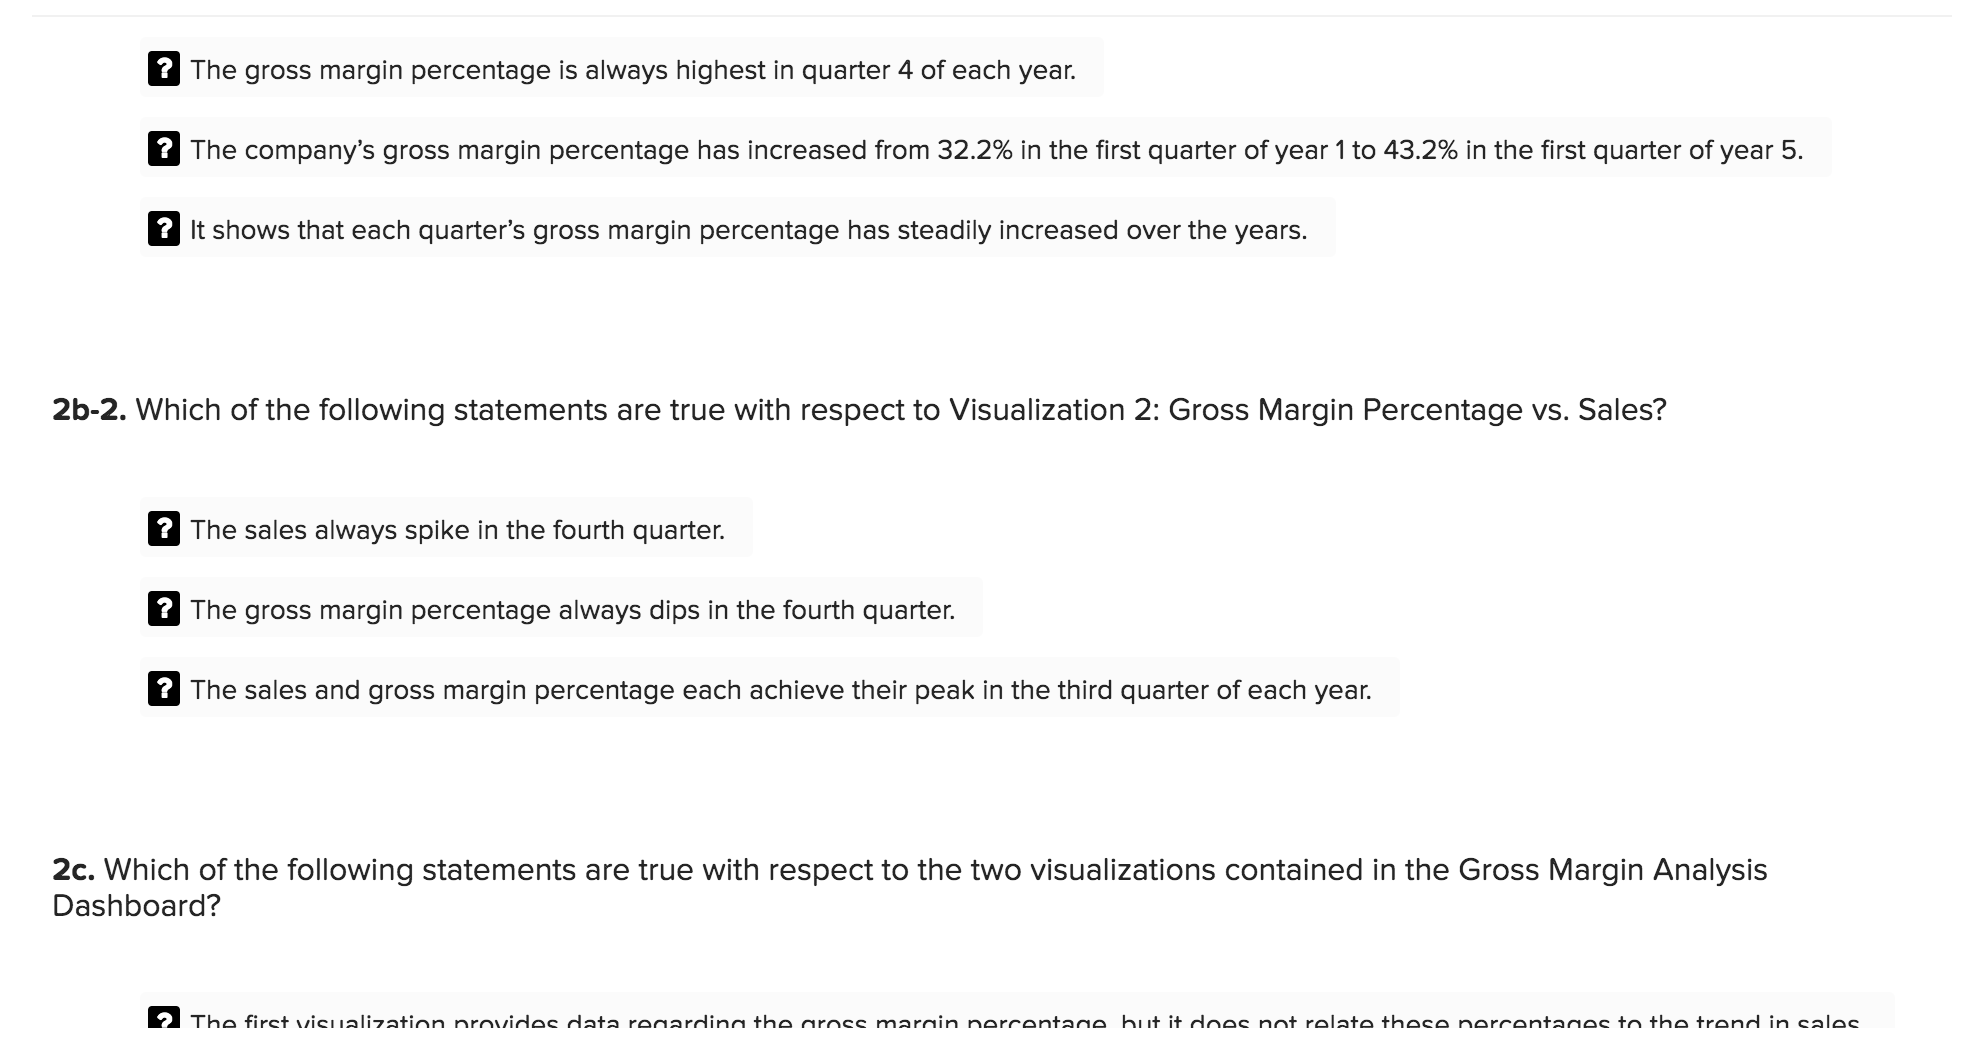
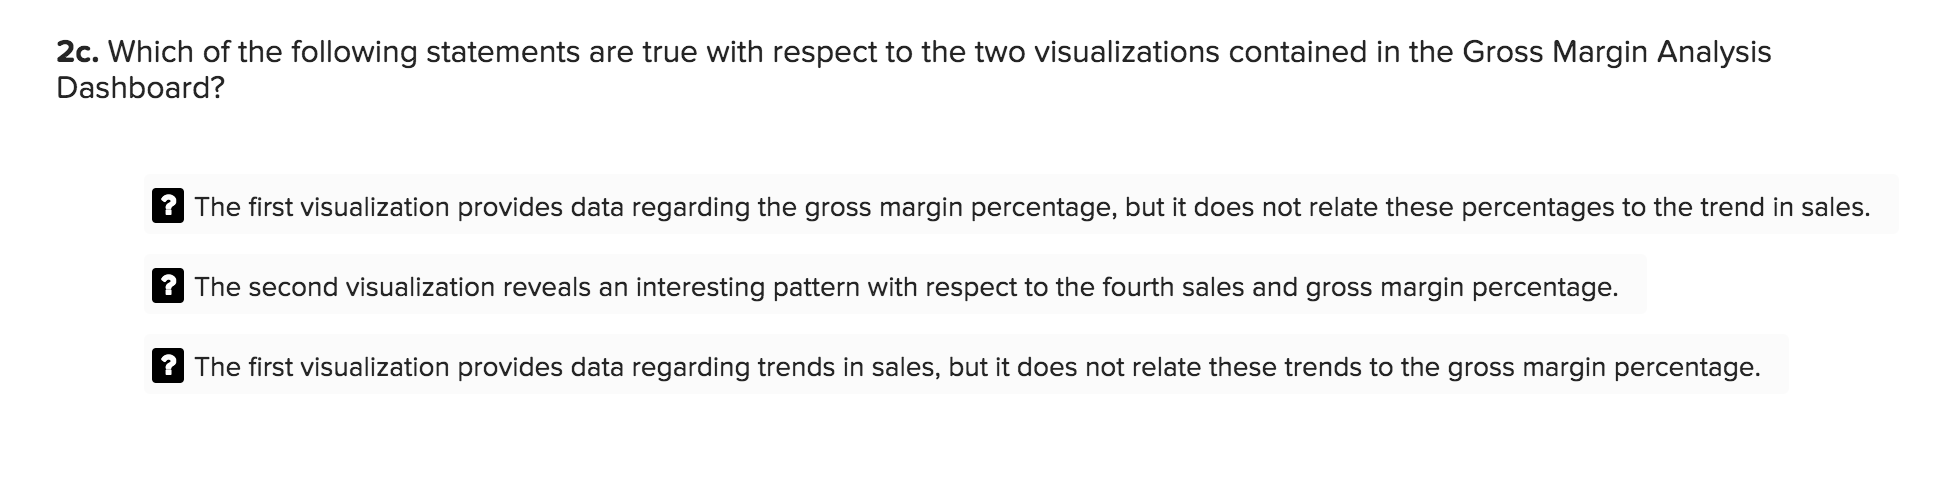
Required information Tableau Dashboard Activity 16-1 (Static) [The following information applies to the questions displayed below. ] This exercise provides a total of13 data visualizations that describe a real company's performance based on 17 quarters of financial data. The visualizations are grouped into ve dashboards that were created in Tableau: (1) sales analysis, (2) gross margin analysis. (3) operating expense analysis, (4) protability analysis, and (5) market performance analysis. Required: For each section, review the Tableau visualizations and answer the questions. Tableau Dashboard Activity 16-1 (Static) Part 2 Refer to the Gross Margin Analysis Dashboard below and answer the questions. Gross Margin Percentage: Year-Over-Year ercentage Gross Margin Percentage 40.0% 30.0% 20.0% 40% 10.0% 0.0% Y1 - Q1 32.2% Y2 - Q1 35.2% Y3 - Q1 37.2% Gross Margin Percentage vs. Sales Y4 - Q1 39.8% Y5 - Q1 43.2% Y1 - Q2 34.6% Y2 - Q2 36.9% Y3 - Q2 38.2% 42.1% Year/Quarter Year/Quarter Y4 - Q2 Y1 - Q3 33.9% Y2 - Q3 35.0% Y3 - Q3 37.0% Y4 - Q3 41.7% Y1 - Q4 31.9% Y2 - Q4 33.8% Y3 - Q4 36.3% Y4 - Q4 38.1%Sales (in billions) Gross Margin Percer 20% $60 $20 0% $40 $0 tableau Y1 - Q1 Y1 - Q2 Y1 - Q3 Y1 - Q4 Y2 - Q1 Y2 - Q2 boxes left with a question mark will be automatically graded as incorrect.) Y2 - Q3 Y2 - Q4 Y3 - Q1 Y3 - Q2 -> Y3 - Q3 2a-1. Which of the following statements are true with respect to Visualization 1: Gross Margin Percentage: Year-Over-Year? Y3 - Q4 a check mark for a correct answer and double click the box with the question mark to empty the box for a wrong answer. Any (Note that for all questions below you may select more than one answer. Single click the box with the question mark to produce Y4 - Q1 Y4 - Q2 Y4 - Q3 Y4 - Q4 Y5 - Q1a The four red bars depict the gross margin percentage for quarters 14 of year 3. a The five blue bars depict the gross margin percentage for the rst quarter of years 15. a The four orange bars depict the gross margin percentage for quarters 14 of year 2. 23-2. Which of the following statements are true with respect to Visualization 2: Gross Margin Percentage vs. Sales? 9 It provides a trend analysis of the quarterly gross margin percentage beginning with the first quarter of year1 and running consecutively through the first quarter of year 5. a It compares gross margin percentage and sales on a yearoveryear basis beginning with quarter1 of years 15 and ending with quarter 4 of years 14' a It provides a trend analysis of the quarterly sales beginning with the first quarter of year 1 and running consecutively through the rst quarter of year 5. 2b-1. Which of the following statements are true with respect to Visualization 1: Gross Margin Percentage: Year-OverYear? a The gross margin percentage is always highest in quarter 4 of each year. ? The gross margin percentage is always highest in quarter 4 of each year. ? The company's gross margin percentage has increased from 32.2% in the first quarter of year 1 to 43.2% in the first quarter of year 5. ? It shows that each quarter's gross margin percentage has steadily increased over the years. 2b-2. Which of the following statements are true with respect to Visualization 2: Gross Margin Percentage vs. Sales? ? The sales always spike in the fourth quarter. ? The gross margin percentage always dips in the fourth quarter. ? The sales and gross margin percentage each achieve their peak in the third quarter of each year. 2c. Which of the following statements are true with respect to the two visualizations contained in the Gross Margin Analysis Dashboard? 2 The first vicnalization provides data ronardina the arnes marain norcontano hut it does not rolate those norcantanos to the trend in caloc2c. Which of the following statements are true with respect to the two visualizations contained in the Gross Margin Analysis Dashboard? a The first visualization provides data regarding the gross margin percentage, but it does not relate these percentages to the trend in sales. a The second visualization reveals an interesting pattern with respect to the fourth sales and gross margin percentage. 9 The first visualization provides data regarding trends in sales, but it does not relate these trends to the gross margin percentage
Step by Step Solution
There are 3 Steps involved in it

Get step-by-step solutions from verified subject matter experts