

Question: Tableau Dashboard Activity 3 - 1 ( Static ) Interpreting Income Statement Data in a Tableau Dashboard [ LO 3 - 5 ] Amazing organization
Tableau Dashboard Activity Static Interpreting Income Statement Data in a Tableau Dashboard LO
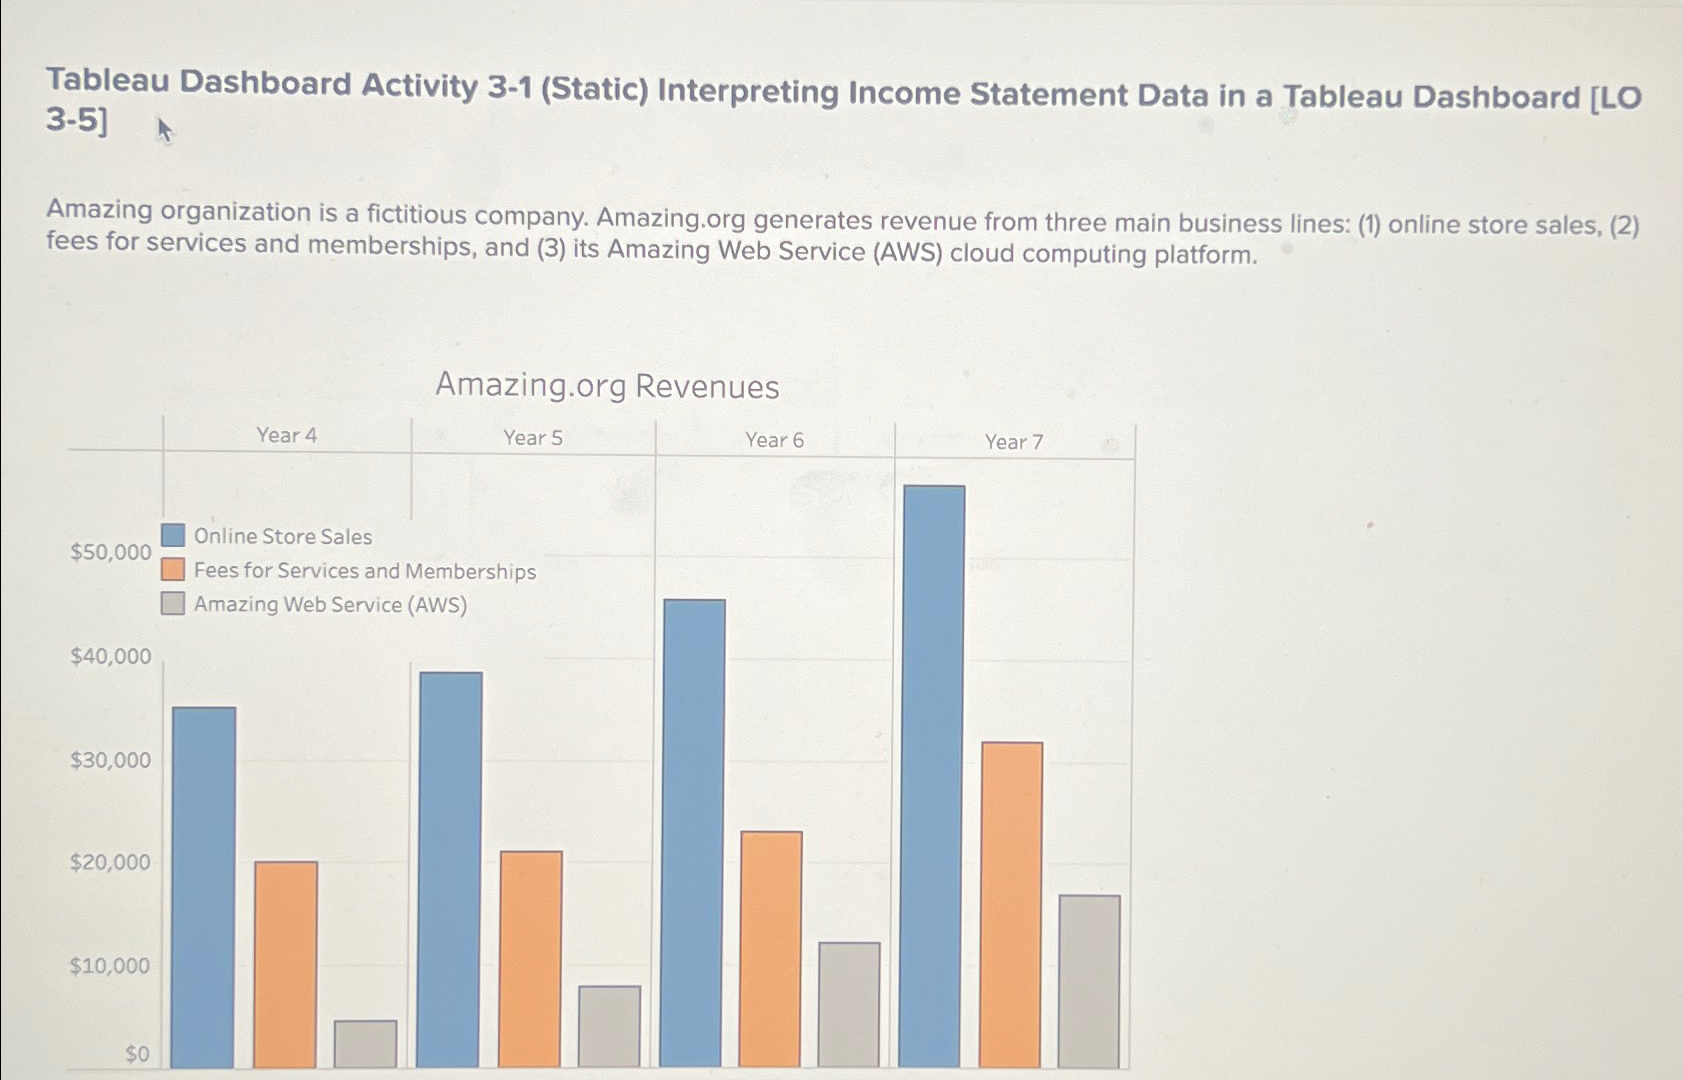
Amazing organization is a fictitious company.
Amazing.org generates revenue from three main business lines: online store sales, fees for services and memberships, and its Amazing Web Service AWS cloud computing platform.
Amazing.org Revenues
Step by Step Solution
There are 3 Steps involved in it
1 Expert Approved Answer
Step: 1 Unlock

Question Has Been Solved by an Expert!
Get step-by-step solutions from verified subject matter experts
Step: 2 Unlock
Step: 3 Unlock