

Question: Tableau Dashboard Activity 2-1 (Static) Interpreting Balance Sheet Data in a Tableau Dashboard [LO 2-1] Pear Corporation is a hypothetical company with financial results similar
![Tableau Dashboard [LO 2-1] Pear Corporation is a hypothetical company with financial](https://s3.amazonaws.com/si.experts.images/answers/2024/07/66a8838adacc5_75466a8838a7a09c.jpg)
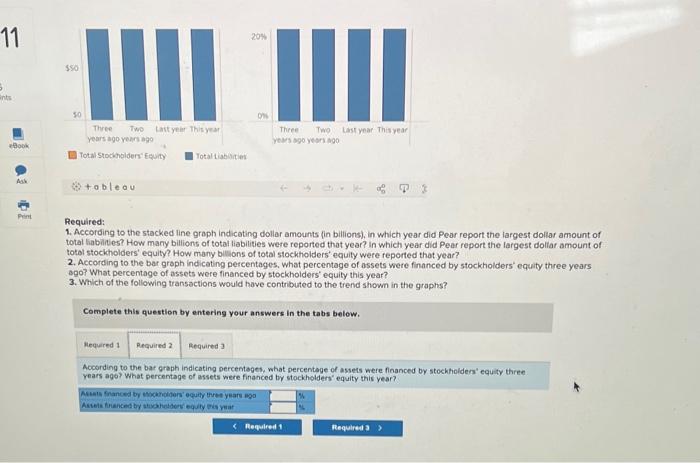
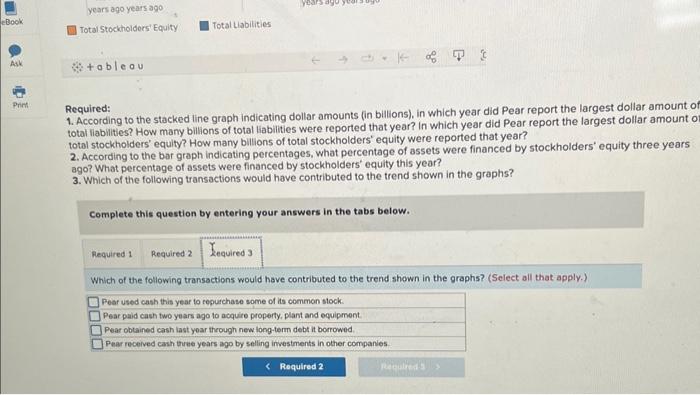
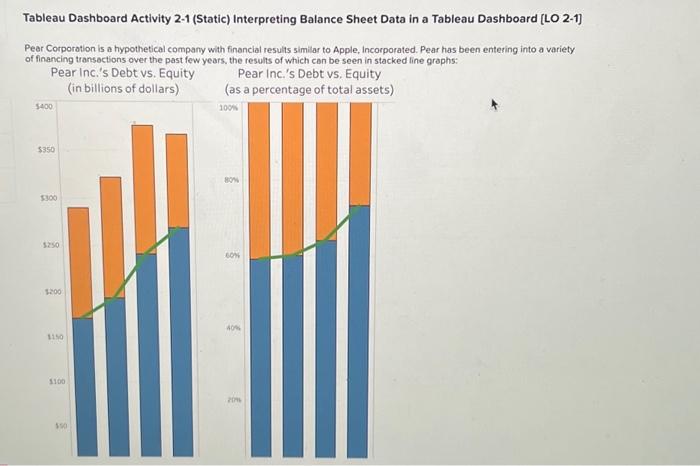
Tableau Dashboard Activity 2-1 (Static) Interpreting Balance Sheet Data in a Tableau Dashboard [LO 2-1] Pear Corporation is a hypothetical company with financial results similar to Apple, incorporated. Pear has been entering into a variety of financing transoctions over the past few years, the results of which can be seen in stacked line graphs: Pear Inc.'s Debt vs. Equity Pear inc.'s Debt vs. Equity (in billions of dollars) (as a percentage of total assets) Required; 1. According to the stacked line graph indicating dollar amounts (in billions), in which year did Pear report the largest dollar amount of total liablities? How many bilions of total liabilities were reported that year? in which year did Pear report the largest dollar amount of total stockhoiders' equity? How many billions of total stockholders' equity were reported that year? 2. According to the bar graph indicating percentages, what percentage of assets were financed by stockhoiders' equity three years ago? What percentage of assets were financed by stockholders' equity this year? 3. Which of the following transactions would have contributed to the trend shown in the graphs? Complete this question by entering your answers in the tabs below. According to the stacked line greph indicating dollar amounts (in billons), in which year did Pear report the largest dollar amount of total habilities? How many billions of total liabilities were reported that year? in which yeart did Peargest doptiar largest dellar amount of totat stockholders' equity? How many billions of total stockholders' equity were reported that year? Required: 1. According to the stacked line graph indiceting dollar amounts (in bilions), in which year did Pear report the iargest dollar amount of total liabilies? How many billions of total liabilities were reported that year? in which year did Pear report the largest doliar ampunt of total stockholders' equity? How many bitions of total stocktholders' equity were reported that year? 2. According to the bar graph indicating percentages, what percentage of assets were financed by stockholders' equity three years sgo? What percentage of assets were financed by stockhoiders' equity this year? 3. Which of the following transoctions would have contributed to the trend shown in the graphs? Complete this question by entering your answers in the tabs below. Acobrding to the bar graph indicating percentages, what percentoge of assets were financed by stockholdeis' equity three Years ago? What percentage of assets were finahced by stockholders' equity this year? Required: 1. According to the stacked line graph indicating dollar amounts (in bllitions), in which year did Pear report the largest dollar amount total liabilities? How many billions of total liabilities were reported that year? In which year did Pear report the largest dollar amount total stockholders' equity? How many bilions of total stockholders' equity were reported that year? 2. According to the bar graph indicating percentages, what percentage of assets were financed by stockholders' equity three years ago? What percentage of assets were financed by stockholders' equity this year? 3. Which of the following transactions would have contributed to the trend shown in the graphs? Cemplete this question by entering your answers in the tabs below. Which of the following transactions would have contributed to the trend shown in the graphs? (Select all that apply.) Tableau Dashboard Activity 2-1 (Static) Interpreting Balance Sheet Data in a Tableau Dashboard [LO 2-1] Pear Corporation is a hypothetical company with financial results similar to Apple, incorporated. Pear has been entering into a variety of financing transoctions over the past few years, the results of which can be seen in stacked line graphs: Pear Inc.'s Debt vs. Equity Pear inc.'s Debt vs. Equity (in billions of dollars) (as a percentage of total assets) Required; 1. According to the stacked line graph indicating dollar amounts (in billions), in which year did Pear report the largest dollar amount of total liablities? How many bilions of total liabilities were reported that year? in which year did Pear report the largest dollar amount of total stockhoiders' equity? How many billions of total stockholders' equity were reported that year? 2. According to the bar graph indicating percentages, what percentage of assets were financed by stockhoiders' equity three years ago? What percentage of assets were financed by stockholders' equity this year? 3. Which of the following transactions would have contributed to the trend shown in the graphs? Complete this question by entering your answers in the tabs below. According to the stacked line greph indicating dollar amounts (in billons), in which year did Pear report the largest dollar amount of total habilities? How many billions of total liabilities were reported that year? in which yeart did Peargest doptiar largest dellar amount of totat stockholders' equity? How many billions of total stockholders' equity were reported that year? Required: 1. According to the stacked line graph indiceting dollar amounts (in bilions), in which year did Pear report the iargest dollar amount of total liabilies? How many billions of total liabilities were reported that year? in which year did Pear report the largest doliar ampunt of total stockholders' equity? How many bitions of total stocktholders' equity were reported that year? 2. According to the bar graph indicating percentages, what percentage of assets were financed by stockholders' equity three years sgo? What percentage of assets were financed by stockhoiders' equity this year? 3. Which of the following transoctions would have contributed to the trend shown in the graphs? Complete this question by entering your answers in the tabs below. Acobrding to the bar graph indicating percentages, what percentoge of assets were financed by stockholdeis' equity three Years ago? What percentage of assets were finahced by stockholders' equity this year? Required: 1. According to the stacked line graph indicating dollar amounts (in bllitions), in which year did Pear report the largest dollar amount total liabilities? How many billions of total liabilities were reported that year? In which year did Pear report the largest dollar amount total stockholders' equity? How many bilions of total stockholders' equity were reported that year? 2. According to the bar graph indicating percentages, what percentage of assets were financed by stockholders' equity three years ago? What percentage of assets were financed by stockholders' equity this year? 3. Which of the following transactions would have contributed to the trend shown in the graphs? Cemplete this question by entering your answers in the tabs below. Which of the following transactions would have contributed to the trend shown in the graphs? (Select all that apply.)
Step by Step Solution
There are 3 Steps involved in it

Get step-by-step solutions from verified subject matter experts