

Question: Tableau Excercise. Please create 2 types of graphs using Tableau. (Bar Graphs, Scales, any graph). Please provide picture of graphs and step by step how
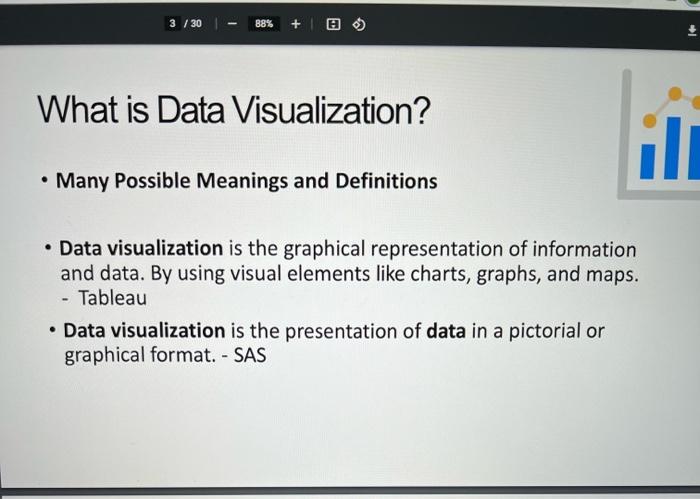
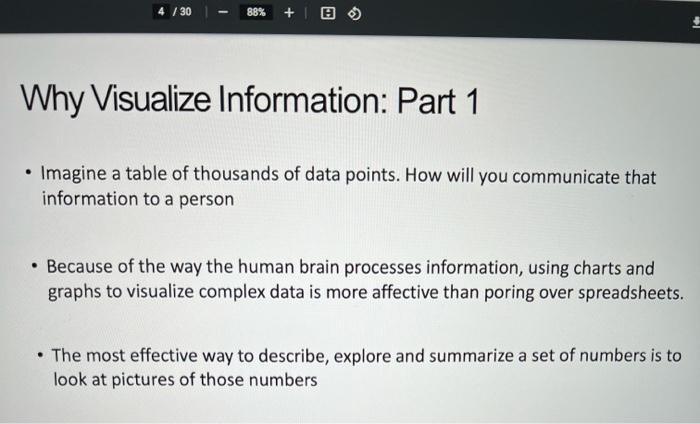
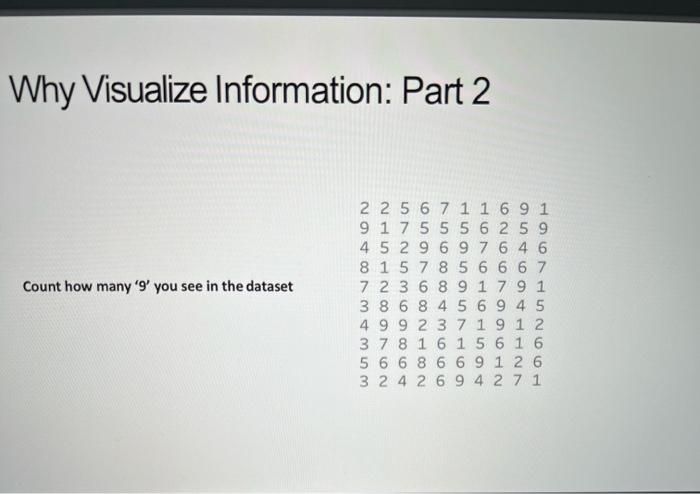
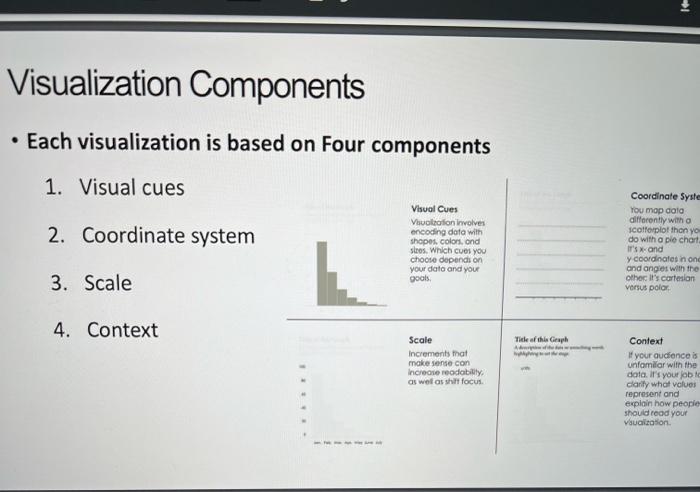
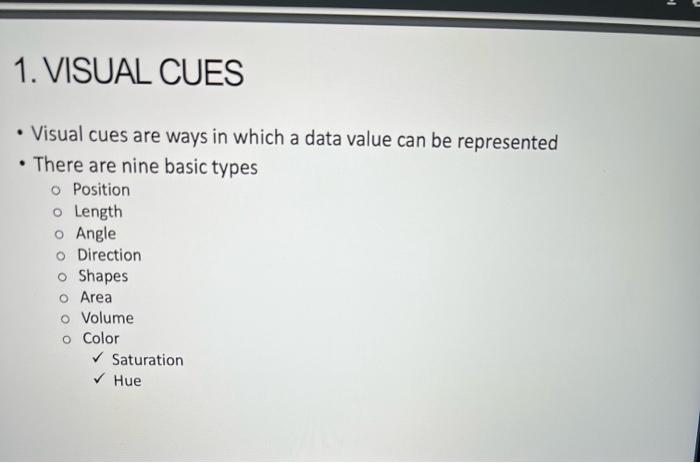
What is Data Visualization? - Many Possible Meanings and Definitions - Data visualization is the graphical representation of information and data. By using visual elements like charts, graphs, and maps. - Tableau - Data visualization is the presentation of data in a pictorial or graphical format. - SAS Why Visualize Information: Part 1 - Imagine a table of thousands of data points. How will you communicate that information to a person - Because of the way the human brain processes information, using charts and graphs to visualize complex data is more affective than poring over spreadsheets. - The most effective way to describe, explore and summarize a set of numbers is to look at pictures of those numbers Why Visualize Information: Part 2 Count how many ' 9 ' you see in the dataset - Each visualization is based on Four components 1. Visual cues 2. Coordinate system 3. Scale - Visual cues are ways in which a data value can be represented - There are nine basic types position Length Angle Direction Shapes Area Volume Color Saturation Hue
Step by Step Solution
There are 3 Steps involved in it

Get step-by-step solutions from verified subject matter experts