

Question: Tables 1 and 2 below are drawn from the article by Bunn P., Ellis C., (2012), Examining the behaviour of individual UK consumer prices, The
Tables 1 and 2 below are drawn from the article by Bunn P., Ellis C., (2012), Examining the behaviour of individual UK consumer prices, The Economic Journal, 122, 558, F35 F55. The aim of the research is to investigate the frequency with which UK consumer prices change. In order to carry out their investigation the researchers analyse the behaviour of individual UK prices using the data that are used in the construction of the UK CPI and using a database of supermarket prices collected from scanner data. 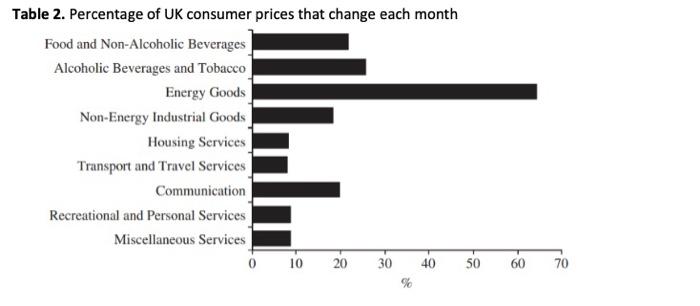
question 1: why is this research of interest for macroeconomists in general and UK policy makers in particular? (5 marks)
question 2: explain at least two reasons that, according to economic theory, might prevent business from changing consumer prices more frequently? (5 marks)
other question about analysing the tables are answered so I didn't include them here. 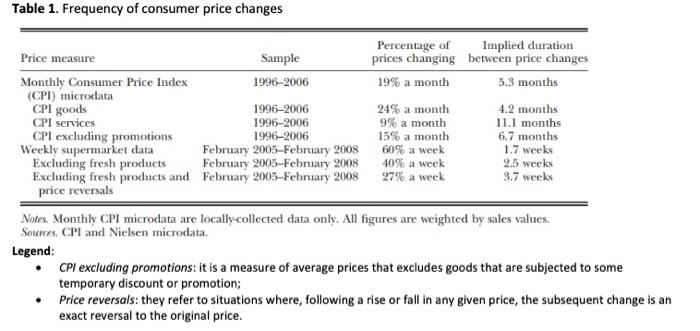
Table 1. Frequency of consumer price changes Notes. Monthly CPI microdata are locally-collected data only. All figures are weighted by sales values. Sourres, CPI and Nielsen microdata. Legend: - CPI excluding promotions: it is a measure of average prices that excludes goods that are subjected to some temporary discount or promotion; - Price reversals: they refer to situations where, following a rise or fall in any given price, the subsequent change is ar exact reversal to the original price
Step by Step Solution
There are 3 Steps involved in it
1 Expert Approved Answer
Step: 1 Unlock

Question Has Been Solved by an Expert!
Get step-by-step solutions from verified subject matter experts
Step: 2 Unlock
Step: 3 Unlock