

Question: Given the data provided in Table 8-2 and Table 8-3 for Red Tomato Tools, use the Excel model to determine the optimal aggregate plan for
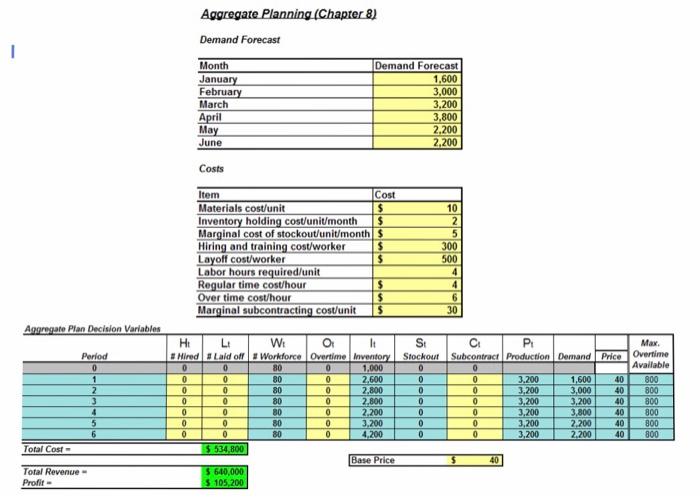
Given the data provided in Table 8-2 and Table 8-3 for Red Tomato Tools, use the Excel model to determine the optimal aggregate plan for the planning horizon. There is a requirement for no stockouts at the end of June and at least 500 units in inventory. What are the total cost, revenue, and profit for this plan? Create a master production schedule (MPS) for the last month in the aggregate plan.
Step by Step Solution
There are 3 Steps involved in it
1 Expert Approved Answer
Step: 1 Unlock

Question Has Been Solved by an Expert!
Get step-by-step solutions from verified subject matter experts
Step: 2 Unlock
Step: 3 Unlock