

TableV The entries in this table give the critical values of t for the specified number...
Fantastic news! We've Found the answer you've been seeking!
Question:
Transcribed Image Text:
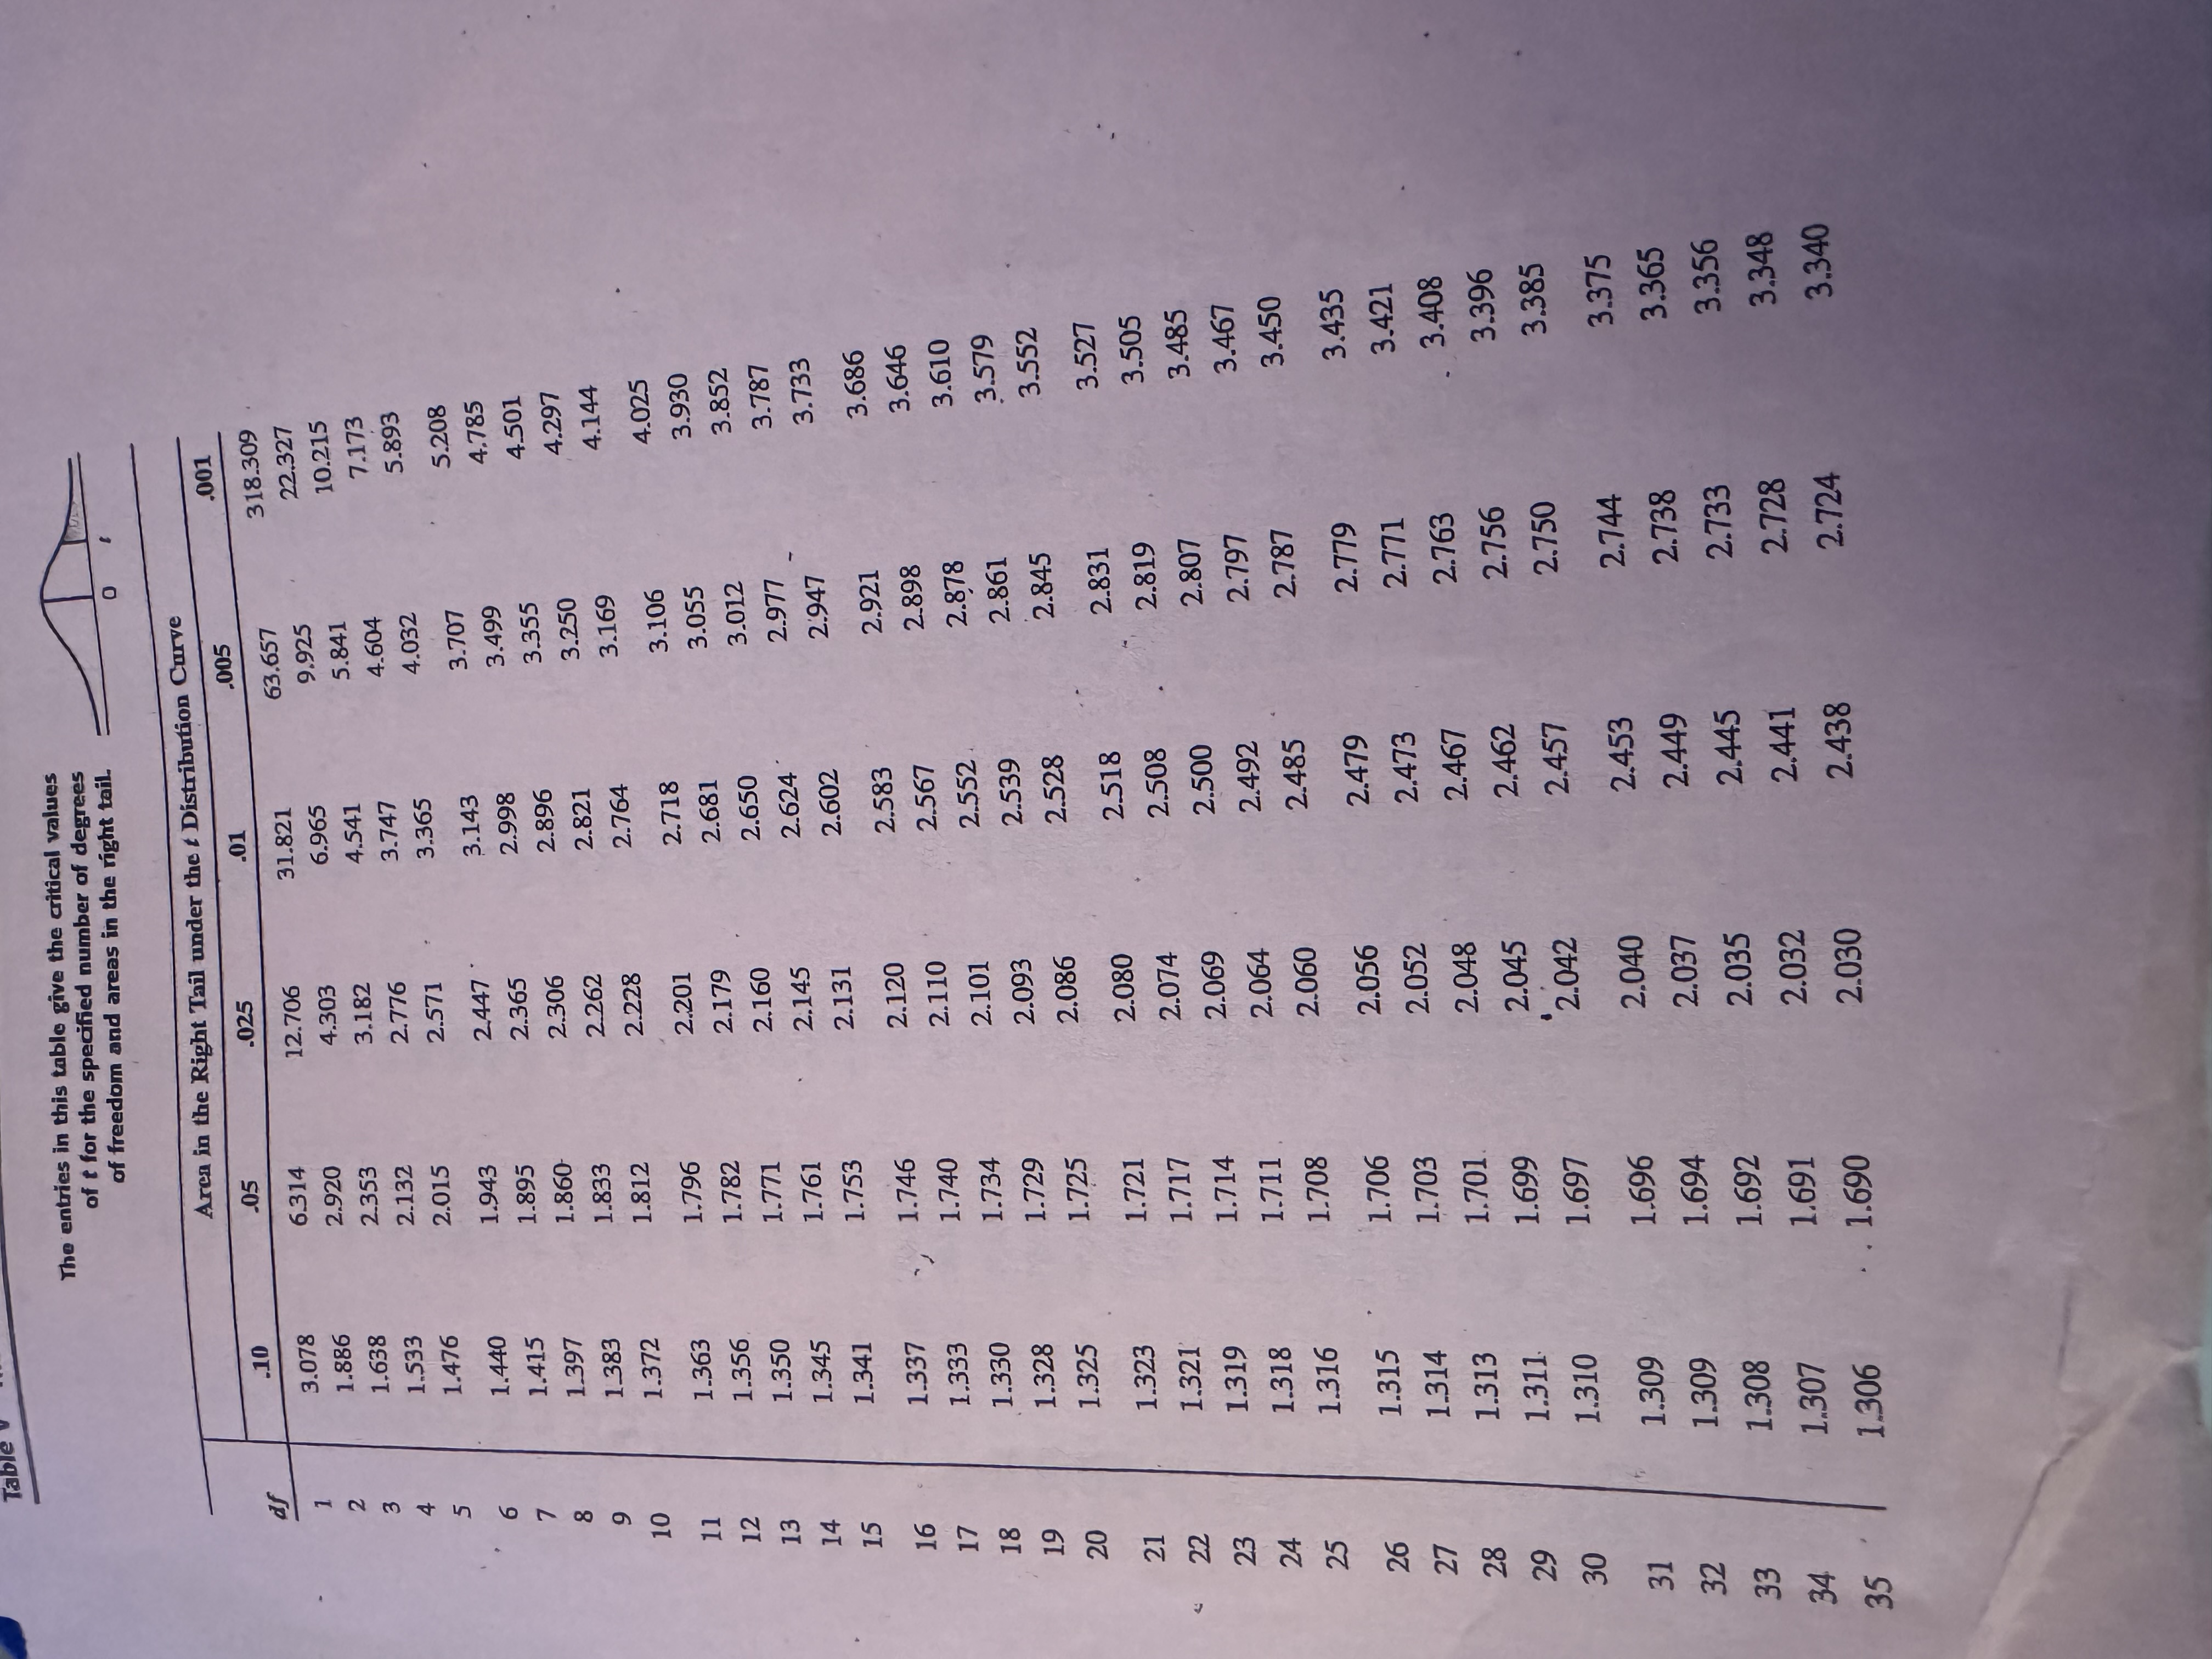
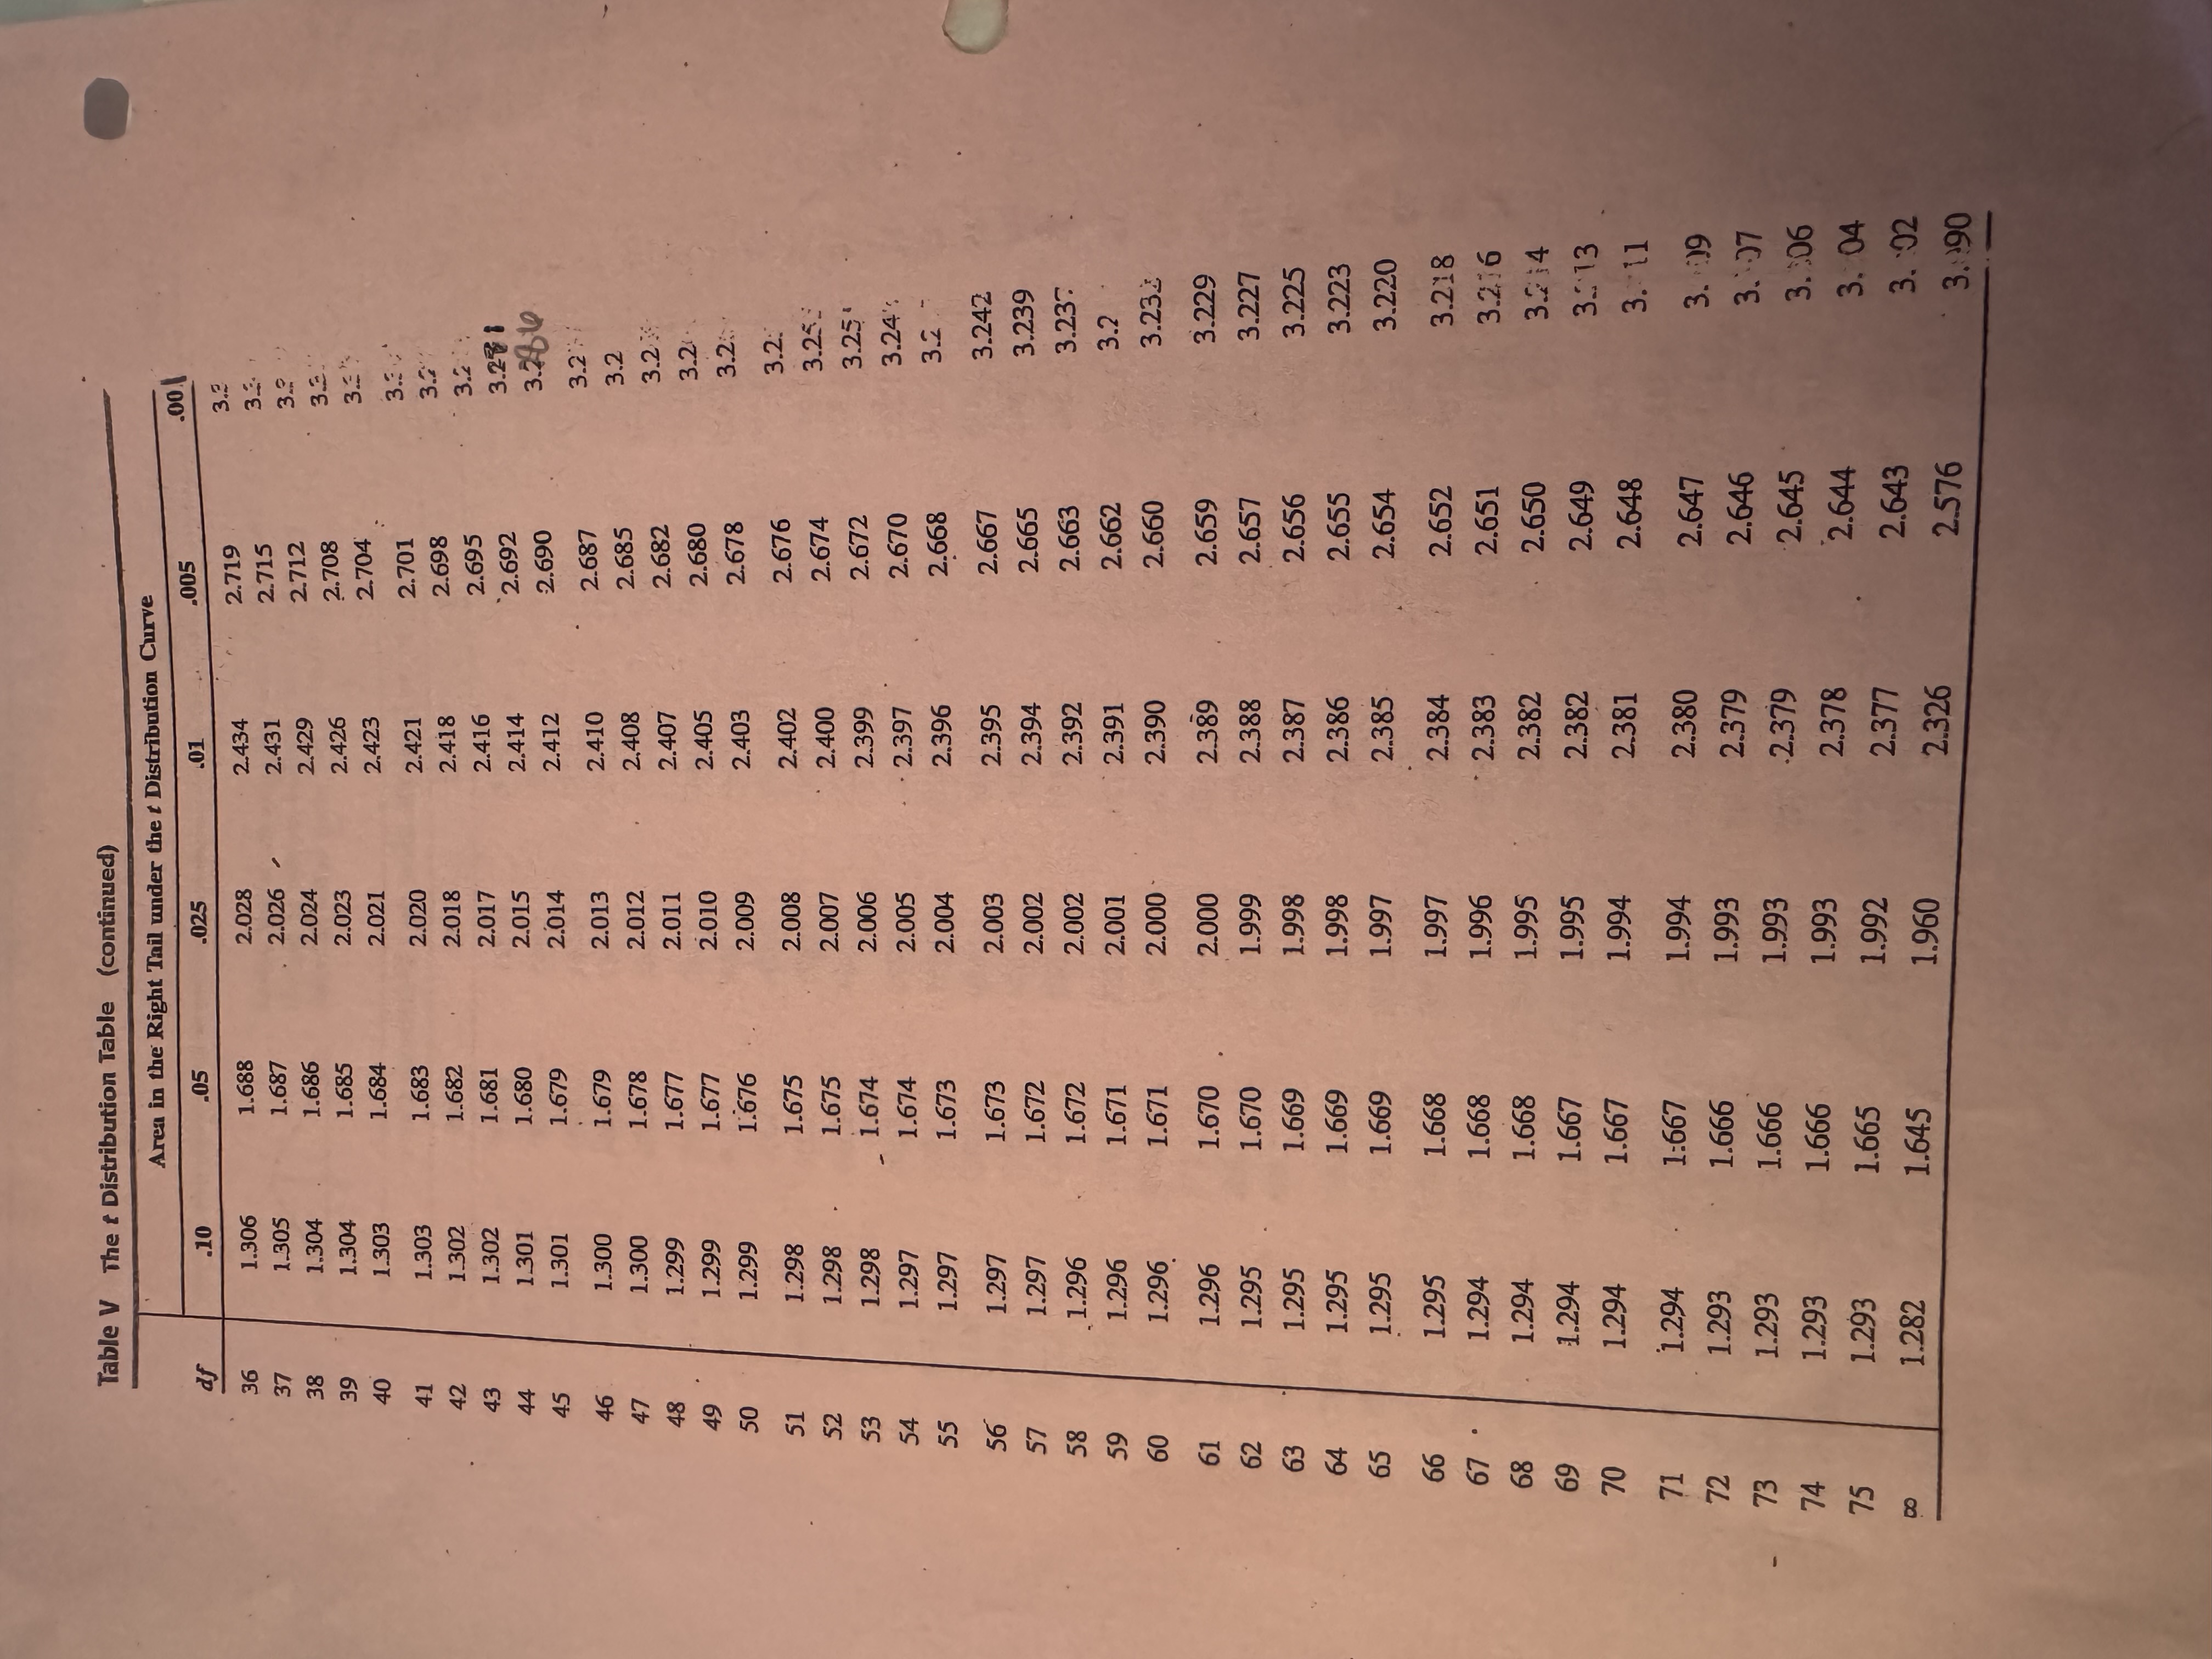
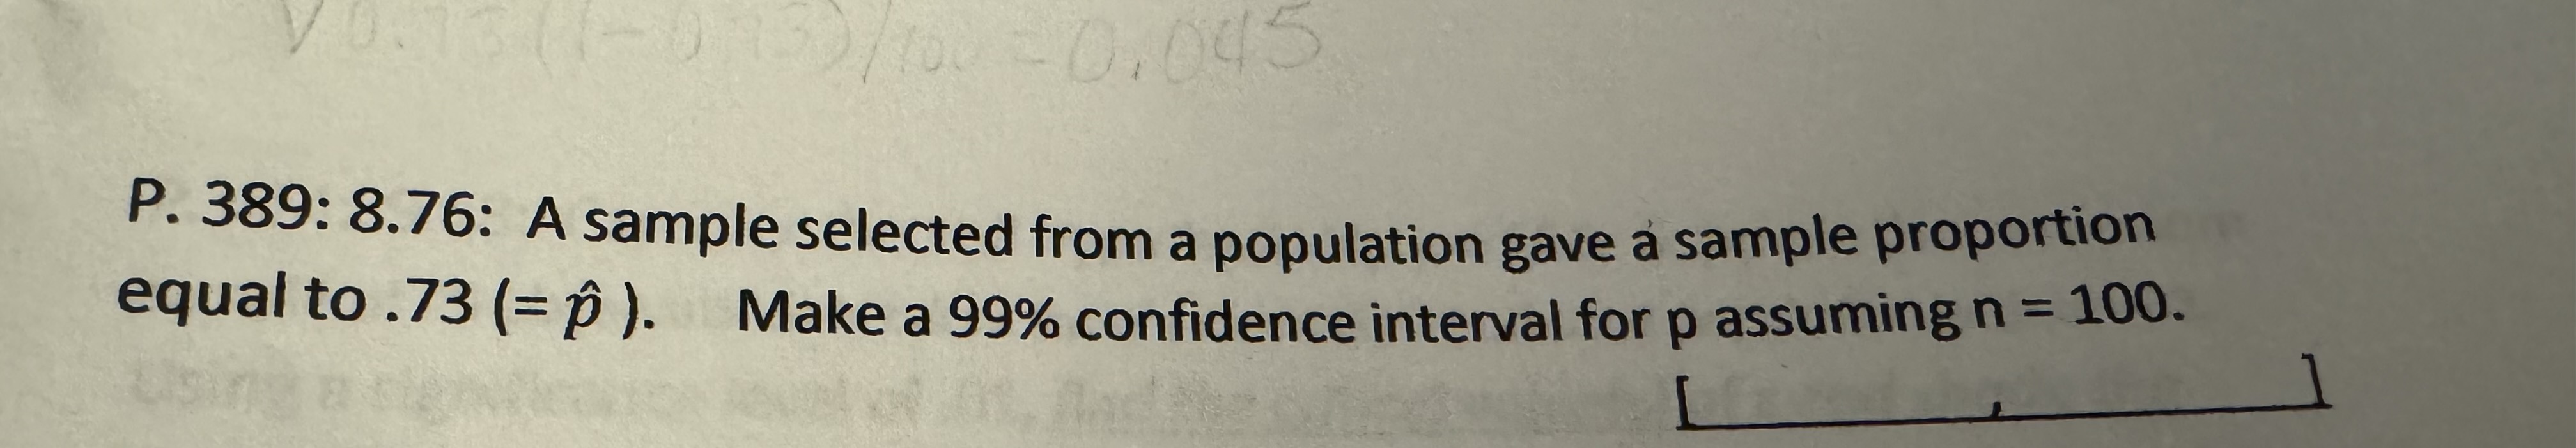
TableV The entries in this table give the critical values of t for the specified number of degrees of freedom and areas in the right tail. Area in the Right Tail under the t Distribution Curve .001 .10 .05 .025 .01 .005 df 2 12 3.078 6.314 12.706 31.821 63.657 318.309 22.327 1.886 2.920 4.303 6.965 9.925 10.215 3 1.638 2.353 3.182 4.541 5.841 4 1.533 2.132 2.776 3.747 4.604 7.173 5 1.476 2.015 2.571 3.365 4.032 5.893 ' 6 69 1.440 1.943 2.447 3.143 3.707 5.208 1.415 1.895 2.365 2.998 3.499 4.785 8 1.397 1.860- 2.306 2.896 3.355 4.501 9 1.383 1.833 2.262 2.821 3.250 4.297 10 1.372 1.812 2.228 2.764 3.169 4.144 11 1.363 1.796 2.201 2.718 3.106 4.025 12 1.356 1.782 2.179 2.681 3.055 3.930 13 1.350 1.771 2.160 2.650 3.012 3.852 14 1.345 1.761 2.145 2.624 2.977 3.787 15 1.341 1.753 2.131 2.602 2.947 3.733 16 1.337 1.746 2.120 2.583 2.921 3.686 1.333 1.740 2.110 2.567 2.898 3.646 1.330 1.734 2.101 2.552 2.878 3.610 28 29 22222222222233 1.328 1.729 2.093 2.539 2.861 3.579 1.325 1.725 2.086 2.528 2.845 3.552 1.323 1.721 2.080 2.518 2.831 3.527 1.321 1.717 2.074 2.508 2.819 3.505 1.319 1.714 2.069 2.500 2.807 3.485 1.318 1.711 2.064 2.492 2.797 3.467 1.316 1.708 2.060 2.485 2.787 3.450 26 1.315 1.706 2.056 2.479 2.779 3.435 27 1.314 1.703 2.052 2.473 2.771 3.421 1.313 1.701. 2.048 2.467 2.763 $ 3.408 1.311 1.699 2.045 2.462 2.756 3.396 1.310 1.697 2.042 2.457 2.750 3.385 1.309 1.696 2.040 2.453 2.744 3.375 1.309 1.694 2.037 2.449 2.738 3.365 1.308 1.692 2.035 2.445 2.733 3.356 1.307 1.691 2.032 2.441 2.728 3.348 35 1.306 .. 1.690 2.030 2.438 2.724 3.340 Table V The t Distribution Table (continued) Area in the Right Tail under the t Distribution Curve .00. df .10 .05 .025 .01 .005 3.2 36 1.306 1.688 2.028 2.434 2.719 3 37 1.305 1.687 2.026 2.431 2.715 3.3 38 1.304 1.686 2.024 2.429 2.712 3.21 39 1.304 1.685 2.023 2.426 2.708 3. 40 1.303 1.684 2.021 2.423 2.704 3.3 41 1.303 1.683 2.020 2.421 2.701 3.27 42 1.302 1.682 2.018 2.418 2.698 3.2 43 1.302 1.681 2.017 2.416 2.695 3.271 44 1.301 1.680 2.015 2.414 2.692 45 1.301 1.679 2.014 2.412 2.690 3.286 3.21 46 1.300 1.679 2.013 2.410 2.687 47 1.300 1.678 2.012 2.408 2.685 3.2 3.2 48 1.299 1.677 2.011 2.407 2.682 49 1.299 1.677 2.010 2.405 2.680 3.2 50 1.299 1.676 2.009 2.403 2.678 3.2 51 1.298 1.675 2.008 2.402 2.676 3.2: 52 1.298 1.675 2.007 2.400 2.674 3.25 53 1.298 1.674 2.006 2.399 2.672 3.25' 54 1.297 1.674 2.005 2.397 2.670 3.24' 55 1.297 1.673 2.004 2.396 2.668 3.2 56 1.297 1.673 2.003 2.395 2.667 3.242 57 1.297 1.672 2.002 2.394 2.665 3.239 58 1.296 1.672 2.002 2.392 2.663 3.23 59 1.296 1.671 2.001 $2.391 2.662 3.2 60 1.296 1.671 2.000 2.390 2.660 3.232 61 1.296 1.670 2.000 2.389 2.659 3.229 62 1.295 1.670 1.999 2.388 2.657 3.227 63 1.295 1.669 1.998 2.387 2.656 3.225 64 1.295 1.669 1.998 2.386 2.655 3.223 65 1.295 1.669 1.997 2.385 2.654 3.220 67 929 66 1.295 1.668 1.997 2.384 2.652 3.218 1.294 1.668 1.996 2.383 2.651 3.216 68 1.294 1.668 1.995 2.382 2.650 3.214 69 1.294 1.667 1.995 2.382 2.649 3:13 70 1.294 1.667 1.994 2.381 2.648 3. 11 71 1.294 1:667 1.994 2.380 2.647 3.09 72 1.293 1.666 1.993 2.379 2.646 73 1.293 3.07 1.666 1.993 .2.379 2.645 74 1.293 3.306 1.666 1.993 2.378 2.644 75 1.293 1.665 3.04 1.992 2.377 1.282 2.643 1.645 3.02 1.960 2.326 2.576 3.990 3)/100=0.045 P. 389: 8.76: A sample selected from a population gave a sample proportion equal to .73 (=p). Make a 99% confidence interval for p assuming n = 100. TableV The entries in this table give the critical values of t for the specified number of degrees of freedom and areas in the right tail. Area in the Right Tail under the t Distribution Curve .001 .10 .05 .025 .01 .005 df 2 12 3.078 6.314 12.706 31.821 63.657 318.309 22.327 1.886 2.920 4.303 6.965 9.925 10.215 3 1.638 2.353 3.182 4.541 5.841 4 1.533 2.132 2.776 3.747 4.604 7.173 5 1.476 2.015 2.571 3.365 4.032 5.893 ' 6 69 1.440 1.943 2.447 3.143 3.707 5.208 1.415 1.895 2.365 2.998 3.499 4.785 8 1.397 1.860- 2.306 2.896 3.355 4.501 9 1.383 1.833 2.262 2.821 3.250 4.297 10 1.372 1.812 2.228 2.764 3.169 4.144 11 1.363 1.796 2.201 2.718 3.106 4.025 12 1.356 1.782 2.179 2.681 3.055 3.930 13 1.350 1.771 2.160 2.650 3.012 3.852 14 1.345 1.761 2.145 2.624 2.977 3.787 15 1.341 1.753 2.131 2.602 2.947 3.733 16 1.337 1.746 2.120 2.583 2.921 3.686 1.333 1.740 2.110 2.567 2.898 3.646 1.330 1.734 2.101 2.552 2.878 3.610 28 29 22222222222233 1.328 1.729 2.093 2.539 2.861 3.579 1.325 1.725 2.086 2.528 2.845 3.552 1.323 1.721 2.080 2.518 2.831 3.527 1.321 1.717 2.074 2.508 2.819 3.505 1.319 1.714 2.069 2.500 2.807 3.485 1.318 1.711 2.064 2.492 2.797 3.467 1.316 1.708 2.060 2.485 2.787 3.450 26 1.315 1.706 2.056 2.479 2.779 3.435 27 1.314 1.703 2.052 2.473 2.771 3.421 1.313 1.701. 2.048 2.467 2.763 $ 3.408 1.311 1.699 2.045 2.462 2.756 3.396 1.310 1.697 2.042 2.457 2.750 3.385 1.309 1.696 2.040 2.453 2.744 3.375 1.309 1.694 2.037 2.449 2.738 3.365 1.308 1.692 2.035 2.445 2.733 3.356 1.307 1.691 2.032 2.441 2.728 3.348 35 1.306 .. 1.690 2.030 2.438 2.724 3.340 Table V The t Distribution Table (continued) Area in the Right Tail under the t Distribution Curve .00. df .10 .05 .025 .01 .005 3.2 36 1.306 1.688 2.028 2.434 2.719 3 37 1.305 1.687 2.026 2.431 2.715 3.3 38 1.304 1.686 2.024 2.429 2.712 3.21 39 1.304 1.685 2.023 2.426 2.708 3. 40 1.303 1.684 2.021 2.423 2.704 3.3 41 1.303 1.683 2.020 2.421 2.701 3.27 42 1.302 1.682 2.018 2.418 2.698 3.2 43 1.302 1.681 2.017 2.416 2.695 3.271 44 1.301 1.680 2.015 2.414 2.692 45 1.301 1.679 2.014 2.412 2.690 3.286 3.21 46 1.300 1.679 2.013 2.410 2.687 47 1.300 1.678 2.012 2.408 2.685 3.2 3.2 48 1.299 1.677 2.011 2.407 2.682 49 1.299 1.677 2.010 2.405 2.680 3.2 50 1.299 1.676 2.009 2.403 2.678 3.2 51 1.298 1.675 2.008 2.402 2.676 3.2: 52 1.298 1.675 2.007 2.400 2.674 3.25 53 1.298 1.674 2.006 2.399 2.672 3.25' 54 1.297 1.674 2.005 2.397 2.670 3.24' 55 1.297 1.673 2.004 2.396 2.668 3.2 56 1.297 1.673 2.003 2.395 2.667 3.242 57 1.297 1.672 2.002 2.394 2.665 3.239 58 1.296 1.672 2.002 2.392 2.663 3.23 59 1.296 1.671 2.001 $2.391 2.662 3.2 60 1.296 1.671 2.000 2.390 2.660 3.232 61 1.296 1.670 2.000 2.389 2.659 3.229 62 1.295 1.670 1.999 2.388 2.657 3.227 63 1.295 1.669 1.998 2.387 2.656 3.225 64 1.295 1.669 1.998 2.386 2.655 3.223 65 1.295 1.669 1.997 2.385 2.654 3.220 67 929 66 1.295 1.668 1.997 2.384 2.652 3.218 1.294 1.668 1.996 2.383 2.651 3.216 68 1.294 1.668 1.995 2.382 2.650 3.214 69 1.294 1.667 1.995 2.382 2.649 3:13 70 1.294 1.667 1.994 2.381 2.648 3. 11 71 1.294 1:667 1.994 2.380 2.647 3.09 72 1.293 1.666 1.993 2.379 2.646 73 1.293 3.07 1.666 1.993 .2.379 2.645 74 1.293 3.306 1.666 1.993 2.378 2.644 75 1.293 1.665 3.04 1.992 2.377 1.282 2.643 1.645 3.02 1.960 2.326 2.576 3.990 3)/100=0.045 P. 389: 8.76: A sample selected from a population gave a sample proportion equal to .73 (=p). Make a 99% confidence interval for p assuming n = 100.
Expert Answer:

Posted Date:
Students also viewed these mathematics questions
-
A heating section consists of a 10 inch diameter duct which houses a 8 kW electric resistance heater. Air enters the heating section at 14.7 psia, 40oF and 35% relative humidity at a velocity of 21...
-
In completing the engagement in Question 3, Zupan pays no costs in March, $2,000 in April, and $2,500 in May (incurred in April). How much expense should the firm deduct from revenues in the month...
-
A random experiment has three possible outcomes a, b, and c, with P(a) = p, P(b) = p 2 , and P(c) = p. What choice(s) of p makes this a valid probability model?
-
Smith \& Daughters obtained a patent for a new optical scanning device. The fees incurred to file for the patent and to defend the patent in court against several companies which challenged the...
-
Joseph Gonzales recently bought a new business that included a small 20-room motel and coffee shop. He hired a young couple to run the business and plans to pay them a monthly salary. The couple will...
-
2) Let's suppose that you are a landlord negotiating a rental contract with tenant ABC. This tenant is willing to pay all operative expenses A. How is such a rental contract called? B. What is the...
-
Sales price per unit is RM200 and the finished goods inventory level is 25% of the next month's unit sales. 5 kilograms of materials are required for each unit produced and the cost is RM50/kg....
-
Ramos was in Australia on a Temporary Skill Shortage Class GK (subclass 482) visa, which was valid for four years. He was sponsored by his employer, Double Chin Pty Ltd, to work as a chef in their...
-
Assume the following: The standard labor rate per hour is $17.00. The standard labor-hours allowed per unit of finished goods is 3 hours. The actual quantity of labor hours worked during the period...
-
Discuss the Four International Strategies and provide an example of each: Global standardization. Localization strategy. Transnational strategy. International strategy.
-
Let's use this space to share and collaborate. As you start this module and go through the assignments, visit this area and address all or any of the questions listed below. Tie your input to one or...
-
Factor u - 9u-2u + 18 by grouping.
-
RST Company has production facilities in Salt Lake City and Cleveland. The probability that in any given year a fire theft will occur in the facility in Salt Lake City is 3 percent. The probability...
-
Rowland Textile Inc. manufactures two products: sweatshirts and T-shirts. The manufacturing process involves two activities: cutting and sewing. Expected overhead costs and cost drivers are as...

Study smarter with the SolutionInn App