Question: tage range value and dz to 2. (30 points) For this question you need to make a survey and ask at least 25 people the
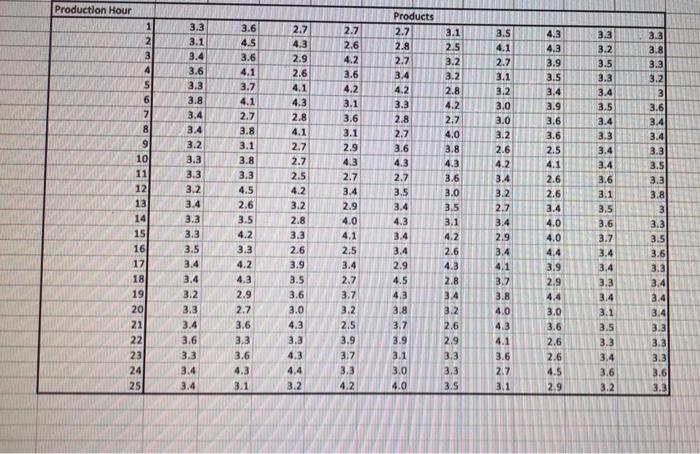
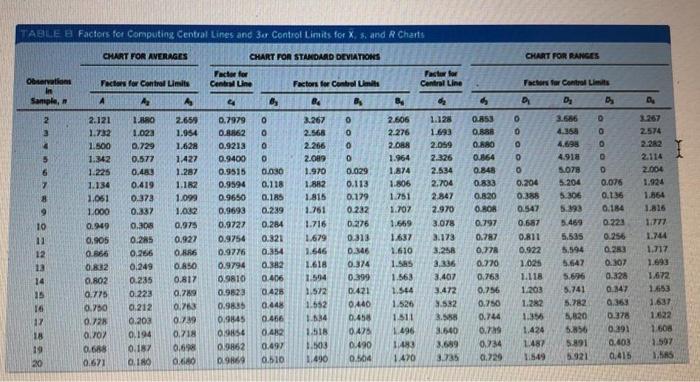
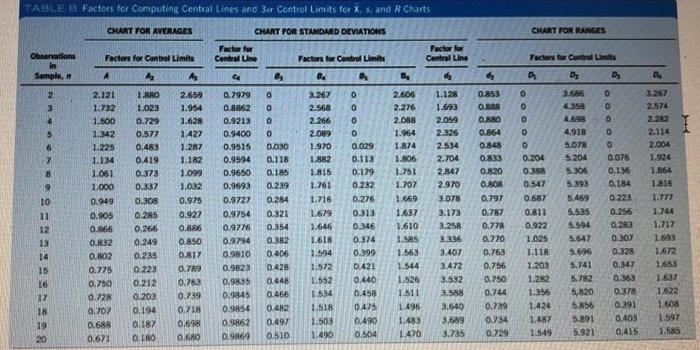
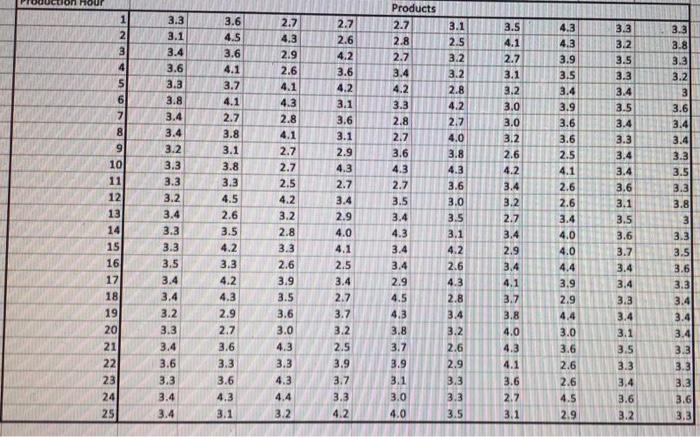
tage range value and dz to 2. (30 points) For this question you need to make a survey and ask at least 25 people the following questions: "Your age?" I "How often do you procrastinate when you need work? (options: never/rarely/sometimes/often/always) "What causes you to procrastinate/delay working?" a) Develop a Pareto chart for the possible reasons causing procrastination. b) Draw a Scatter diagram showing the relationship between age and frequency of procrastination. Does there seem to be a positive or negative correlation? c) Using survey results (and possibly brainstorming), draw a Fish-bone diagram showing the possible causes of procrastination in a work environment (you could choose a specific work environment or talk about a general one). d) Based on your analysis in (a), (b) and (c), what would be your recommendations to reduce procrastination in a work environment? Production Hour 3.3 BE NMNOG 3.3 3.1 3.4 3.6 3.3 3.8 3.4 3.4 3 3.6 4.5 3.6 4.1 3.7 4.1 2.7 3.8 3.1 3.8 3.3 4.5 2.6 3.5 4.2 3.3 4.2 4.3 2.9 2.7 3.6 3.3 3.6 10 11 12 13 14 15 16 17 18 19 20 21 22 23 241 25 3.1 2.5 3.2 3.2 2.8 4.2 2.7 4.0 3.8 4.3 3.6 3.0 3.5 3.1 3.3 3.2 3 3.6 3.4 3.4 3.3 3.5 3.3 3.8 3.3 3.3 3.2 3.4 3.3 3.3 3.5 3.4 3.4 3.2 3.3 3.4 3.6 2.7 4,3 2.9 2.6 4.1 4.3 2.8 4.1 2.7 2.7 2.5 4.2 3.2 2.8 3.3 2.6 3.9 3.5 3.6 3.0 4.3 3.3 4.3 4.4 3.2 2.7 2.6 4.2 3.6 4.2 3.1 3.6 3.1 2.9 4.3 2.7 3.4 2.9 4.0 4,1 2.5 3.4 2.7 3.7 Products 2.7 2.8 2.7 3.4 4.2 3.3 2.8 2.7 3.6 4.3 2.7 3.5 3.4 4.3 3.4 3.4 2.9 4.5 4.3 3.8 3.7 3.9 3.1 3.0 3.5 4.1 2.7 3.1 3.2 3.0 3.0 3.2 2.6 4.2 3.4 3.2 2.7 3.4 2.9 3.4 4.1 3.7 3.8 4.0 4.3 4.1 3.6 2.7 3.1 3.9 3.5 3.4 3.9 3.6 3.6 2.5 4.1 2.6 2.6 3.4 4.0 4.0 4.4 3.9 2.9 4.4 3.0 3.6 2.6 2.6 4.5 2,9 3.3 3.2 3.5 3.3 3.4 3.5 3.4 3.3 3.4 3.4 3.6 3.1 3.5 3.6 3.7 3.4 3.4 3.3 3.4 3.1 3.5 3.3 3.4 3.6 3.2 4.2 2.6 4.3 2.8 3.4 3.2 2.6 2.9 33 3.3 3.5 3.6 3.3 3.4 3.4 3.4 3.3 3.2 2.5 3.9 3.7 3.4 3.3 3.3 3.6 3.3 3.4 3.1 4.2 4.0 3.5 TABLE B Factors for Computing Central Lines and 3er Control Limits for X s. and R Charts CHART FOR AVERAGES CHART FOR RANGES Observations CHART FOR STANDARD DEVIATIONS Factor for CentLine Factors for Control 4 6, BA B Factor for Central Line Factor for Controls Sample, B, 0, 0 3.556 4.364 0 0 0 2574 OOOO OOO 0 0 0 0 0.029 2.606 2.276 2.088 1.964 1.874 1.806 1.751 1.702 1.569 D 2.114 2.004 1.924 0.113 7 8 0.179 Factor for Control Limits A A A 2.121 1.380 2.659 1.732 1.023 1.954 1.500 0.729 1.628 1.342 0.577 1.427 1.225 0.483 1.287 1.134 0.419 1.182 1.051 0.373 1.099 1.000 0.337 1.032 0.949 0,308 0.975 0.905 0.285 0.922 0.866 0.266 0.86 0.832 0.249 0.850 0.802 0.235 0.817 0.775 0.223 0.79 0.750 0.212 0.763 0.72 0.200 0739 0.707 0.194 0.718 0.688 0.187 0.6 0,621 OTRO 0.600 1.816 0.7979 0.8.362 0.9213 0.9400 0.9515 0.9594 0.9650 0.9693 0.9727 0.9754 0.9776 0.9794 0.9810 0.982 0.9835 0.9845 09854 0.9862 DE969 10 1 12 13 14 15 16 17 18 19 20 3.267 2.568 2.266 2.089 1.970 1.882 1.815 1.761 1.716 1.679 1.646 1.618 1.504 1.572 1.552 1.684 1.518 1.13 1.490 0.030 0.118 0.185 0.289 0.284 0.321 0.354 0.382 0.406 0.425 0.448 0.466 0.482 0.497 0.510 5.078 5.204 5.306 5.893 5.469 5.535 1.128 1.693 2.059 2.325 2.534 2.704 2.847 2.970 3.078 3.173 3.258 3336 3.407 3.472 3.532 3. 3.640 0.204 0.388 0.547 0.687 0.811 0.922 1.025 1.118 0.282 0.276 0.313 0.346 0.374 0.399 0.421 04:40 0458 0.475 0.490 0.564 0.853 0.888 O.RO 0.864 0.845 0.833 0.8.20 O.BOR 0.797 0.787 0,77 0.720 0.768 0.756 0.750 0.744 0.79 0.734 0.229 1.637 1.610 1.585 1.563 1.544 1.526 1.511 1.496 1.489 1.470 0.076 0.136 0.184 0.223 0.256 0.23 0.307 0.328 0.847 0.363 0.378 0.391 0.403 0,415 1.203 1.744 1.717 1.693 1.672 14:53 1.637 1622 1.608 1.597 5.6196 5.741 5.782 5.620 5.856 5.891 5.921 1.22 1.395 1.424 1.487 1.549 3735 1.SAS TABLE B Factors for Computing Central Lines and 3r Control Limits for X s. and R Charts CHART FOR AVERAGES CHART FOR STANDARD DEVIATIONS CHART FOR RANGES Observations Factor for Centre Une Factor for Central Line Tactors for Control Limits Factor for Control Limits A A. Ag Factor for Control Units B4 Sample, 02 Ds 2 0 DO 0.853 ORA 2.585 4.358 0 2.574 1.128 1.643 2.059 2.326 0.880 0.864 0.848 0.833 0.8.20 OBOB 8 9 10 11 12 13 14 15 16 17 28 19 20 2.121 1.732 1.500 1.342 1.226 1.134 1.051 1.000 0.949 0.905 0.836 0.832 0.802 0.775 0.750 0.728 0,707 0.688 0.673 1.RO 1.023 0.729 0.577 0.489 0.419 0.373 0.837 0.305 0.285 0.266 0.249 0.235 0.223 0.212 0.203 0.194 0.187 O.RO 2.659 1.954 1.628 1,427 1.287 1.182 1.099 1.032 0.975 0.927 0.686 0.850 0.817 0.789 0.763 0.739 0.718 0.69 0.680 0.7979 0.8862 0.9218 0.9400 0.9615 0.9594 0.9650 0.9693 0.9727 0.9754 0.9776 0.9794 0.9810 0.9823 0.9835 0.0845 0.956 0.9862 DL969 0 0 0.030 0.118 0.185 0.289 0.284 0.321 0.354 0.382 0.406 0.428 0.448 0.466 0.43 0.497 0.510 3.267 2.568 2.266 2.089 1.970 1.882 1.815 1.761 1.716 1.679 1.646 1.618 1.534 1.572 1.552 1634 1.518 1.503 0.029 0.113 0.179 0.232 0.276 0.313 0.346 0.374 0.399 0.421 0440 0.458 0.425 0.490 0.504 2.606 2.276 2.088 1.964 1.874 1.806 1.751 1.707 1.659 1.687 1.610 1.55 1.563 1.544 1.626 1 511 1496 1.483 1.470 2.704 2.847 2.970 3.078 3.173 3.258 3.236 3.407 3.472 3.532 3.588 3.540 3.689 3.735 0.797 0.787 0.778 0.770 0,763 0.756 0.750 0.744 0.789 0.734 0.729 0 O 0.204 0.383 0.547 0.687 0.011 0.922 1.025 1.118 1.203 1.282 1.355 1424 1.487 1.549 4.698 4.918 5078 5.204 5.306 5.393 5.469 5.535 5.504 5.647 5.695 5.741 5.782 5,820 5.856 5.891 5.921 D o 0 G 0 0.076 0.136 0.184 0.223 0.256 0.23 0.307 0.328 0.347 0.365 0.378 0.391 0.403 0,415 2.114 2.004 1.924 1.864 1.816 1.777 1.744 1.717 1.693 1.672 1453 1.637 1622 1.608 1.597 1.A 1.690 won hour 1 2 3 4 5 6 7 8 9 10 11 12 13 14 3.3 3.1 3.4 3.6 3.3 3.8 3.4 3.4 3.2 3.3 3.3 3.2 3.4 3.3 3.3 3.5 3.4 3.4 3.2 3.3 3.4 3.6 3.3 3.4 3.4 3.6 4.5 3.6 4.1 3.7 4.1 2.7 3.8 3.1 3.8 3.3 4.5 2.6 8.5 4.2 3.3 4.2 4.3 2.9 2.7 3.6 3.3 3.6 4.3 3.1 2.7 4.3 2.9 2.6 4.1 4.3 2.8 4.1 2.7 2.7 2.5 4.2 3.2 2.8 3.3 2.6 3.9 3.5 3.6 3.0 4.3 3.3 4.3 4.4 3.2 2.7 2.6 4.2 3.6 4.2 3.1 3.6 3.1 2.9 4.3 2.7 3.4 2.9 4.0 4.1 2.5 3.4 2.7 3.7 3.2 2.5 3.9 3.7 3.3 4.2 Products 2.7 2.8 2.7 3.4 4.2 3.3 2.8 2.7 3.6 4.3 2.7 3.5 3.4 4.3 3.4 3.4 2.9 4.5 4.3 3.8 3.7 3.9 3.1 3.0 4.0 3.1 2.5 3.2 3.2 2.8 4.2 2.7 4.0 3.8 4.3 3.6 3.0 3.5 3.5 4.1 2.7 3.1 3.2 3.0 3.0 3.2 2.6 4.2 3.4 3.2 2.7 3.4 2.9 3.4 4.1 3.7 3.8 4.0 4.3 4.1 3.6 2.7 3.1 4.3 4.3 3.9 3.5 3.4 3.9 3.6 3.6 2.5 4.1 2.6 2.6 3.4 4.0 4.0 4.4 3.9 2.9 3.3 3.2 3.5 3.3 3.4 3.5 3.4 3.3 3.4 3.4 3.6 3.1 3.5 3.6 3.7 3.4 3.4 3.3 3.4 3.1 3.5 3.3 3.4 3.6 3.2 3.3 3.8 3.3 3.2 3 3.6 3.4 3.4 3.3 3.5 3.3 3.8 3 3.3 3.5 3.6 3.3 3.4 3.4 3.4 3.3 3.3 3.3 3.6 3.3 3.1 15 16 17 18 19 20 4.2 2.6 4.3 2.8 3.4 3.2 2.6 2.9 3.3 3.3 3.5 21 22 23 24 25 3.0 3.6 2.6 2.6 4.5 2.9