

Question: 3. Demonstrate diagrammatically and/or numerically TOTAL FIXED COST TOTAL VARIABLE COST MARGINAL COST AVERAGE FIXED COST AVERAGE TOTAL COST AVERAGE VARIABLE COST Output (Q)
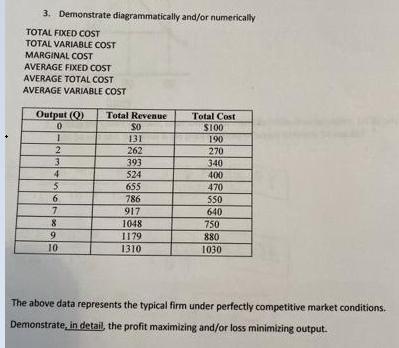
3. Demonstrate diagrammatically and/or numerically TOTAL FIXED COST TOTAL VARIABLE COST MARGINAL COST AVERAGE FIXED COST AVERAGE TOTAL COST AVERAGE VARIABLE COST Output (Q) Total Revenue Total Cost S100 131 190 2 262 393 270 340 400 470 50 640 750 3. 4 524 5. 655 786 917 1048 I179 9. 880 10 1310 1030 The above data represents the typical firm under perfectly competitive market conditions. Demonstrate, in detail, the profit maximizing and/or loss minimizing output.
Step by Step Solution
3.40 Rating (162 Votes )
There are 3 Steps involved in it
To determine the profitmaximizing andor lossminimizing output for this firm well calculate several cost measures total fixed cost TFC total variable c... View full answer

Get step-by-step solutions from verified subject matter experts