Question: Tapiti Footaction Future Help & Support XFINITY.com XFINITY Search Y XFINITY TV On Demand * Levi's Jeans Skinny you Part 1: Correlation and Linear Regression
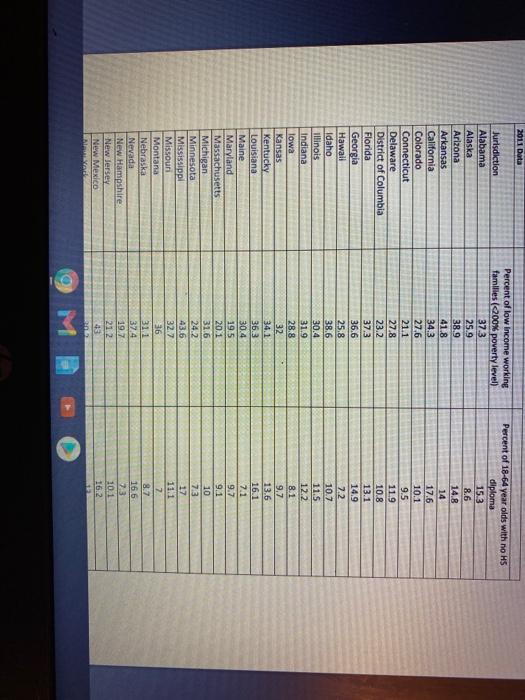
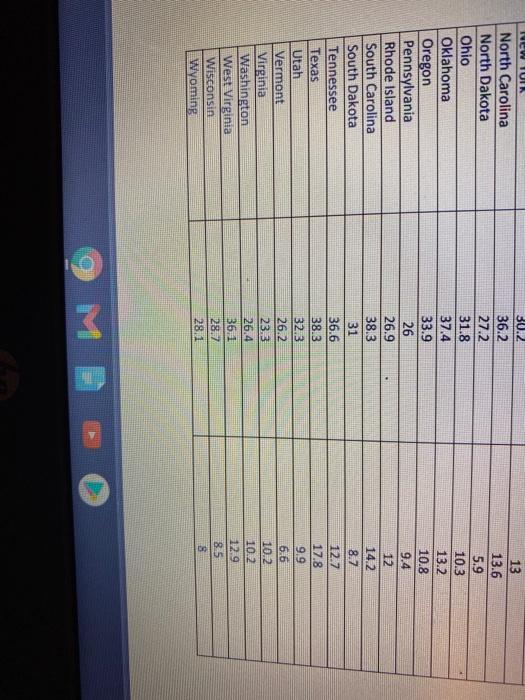
Tapiti Footaction Future Help & Support XFINITY.com XFINITY Search Y XFINITY TV On Demand * Levi's Jeans Skinny you Part 1: Correlation and Linear Regression It is widely believed that the more education one receives the higher the income earned at the time of first employment and over the course of a career. However, due to varying reasons, many people never complete high school and, thus, never receive their high-school diploma. Although individuals without a high-school diploma are often able to find employment, they experience economic outcomes quite different from those who finish high school before entering the workforce to earn a living. Across the nation, there are millions of individuals with families who are now working but do not possess the credentials of a high-school diploma. Many of these individuals and their families are considered to be a part of the working poor that make up a considerable portion of this nation's labor force. TO OPEN Data In StatCrunch From MSL links in Bb select the Pearson link: MyLab and Mastering Course Home Then in left column, select: StatCrunch-StatCrunch Website Open StarCrunch Hover over link below, while holding down the CTRL key, SELECT it with the mouse or touch pad. PROJECT DATA UNK 1. Use technology to create and provide a scatterplot of the association between the "percent of low- income working families" and the "percent of 18-64 yr-olds with no high school diploma" data for each jurisdiction. Copy and paste the scatterplot and be sure to clearly identify the predictor and response variables based on the possible believed association. Write at least two sentences explaining how/why it is appropriate to create such a scatterplot, and describe the characteristics of the association seen in the scatterplot. Be sure to use the actual names of the variables in their appropriate places in your response(s). 2. Use technology to find the regression equation for the linear association between the "percent of low-income working families" and the "percent of 18-64 yr-olds with no high school diploma." Round final values to two decimal places.) Provide this equation and write a brief interpretation of the slope using the variable names. Print or copy-and-paste the printout that identified the equation of the linear regression line JULY Uie WeULTUR UND response variables based on the possible believed association. Write at least two sentences explaining how/why it is appropriate to create such a scatterplot, and describe the characteristics of the association seen in the scatterplot. Be sure to use the actual names of the variables in their appropriate places in your response(s). 2. Use technology to find the regression equation for the linear association between the percent of low-income working families and the "percent of 18-64 yr-olds with no high school diploma." (Round final values to two decimal places.) Provide this equation and write a brief interpretation of the slope using the variable names. Print or copy-and-paste the printout that identified the equation of the linear regression line. 3. A student states that a decrease in the percent of 18-64 yr-olds with no high school diplomo will lead to a decrease in the percent of low-income working families." Write at least two concise sentences addressing the key uses of linear correlation and comment on its limitations in a response to the student's statement. 4. Calculate and provide the R-squared value for the regression equation. Provide a statement about its meaning, in general, and, its specific interpretation in the context of this assignment. 5. After examining these data for all the jurisdictions, someone notes that certain areas have an unusually high "percent of 18-64 yr-olds with no high school diploma." Based on this finding this individual concludes that the high percentages are due to the rising population of immigrants in those areas. Further, the individual argues that any estimates of the associated "percent of low-income working families in those areas should be recalculated after removing this sub-population from the data set as they are cousing the area to "look bad". In addition to thinking critically, use the key rules about linear regression and extrapolation to write a statistically appropriate and socially responsible response to the individual's conclusion and argument. 9 M 2011 Data Jurisdiction Alabama Alaska Arizona Arkansas California Colorado Connecticut Delaware District of Columbia Florida Georgia Hawaii Idaho Illinois Indiana Iowa Kansas Kentucky Louisiana Maine Maryland Massachusetts Michigan Minnesota Mississippi Missouri Montana Nebraska Nevada New Hampshire New Jersey New Mexico ad Percent of low Income working families (200% poverty level) 37.3 25.9 38.9 41.8 34.3 27.6 21.1 27.8 23.2 37.3 36,6 25.8 38.6 30.4 31.9 28.8 32 Percent of 18-64 year olds with no HS diploma 153 8.6 14.8 14 17.6 10.1 95 119 10.8 13.1 14.9 7.2 10.7 11.5 12.2 8.1 9.7 13.6 16.1 7.1 9.7 9.1 10 7.3 17 11.1 7 8.7 16.6 36.3 30.4 19 20.1 31.6 24.2 43.6 32.7 36 311 37.4 19.7 212 10.1 16.2 200 NEW TUIK North Carolina North Dakota Ohio Oklahoma Oregon Pennsylvania Rhode Island South Carolina South Dakota Tennessee Texas Utah Vermont Virginia Washington West Virginia Wisconsin Wyoming 30.2 36.2 27.2 31.8 37.4 33.9 26 26.9 38.3 31 36.6 38.3 32.3 26.2 23.3 26.4 36.1 28.7 28.1 13 13.6 5.9 10.3 13.2 10.8 9.4 12 14.2. 8.7 12.7 17.8 9.9 6.6 10.2. 10.2 12.9 8.5 8 9 MB 6. Describe in two or three sentences how a simple random sample of size n=20 could be obtained from the full list of jurisdictions provided for use with this assignment. 7. A researcher reported that a sample of size n=30 produced a sample mean of 32.56% and a sample standard deviation of 6.56%. Use this information to calculate a 90% confidence interval for the national average for the "percent of low-income working families". Provide the upper and lower limits of the confidence interval and the margin of error. (Round the limits to two decimal places.) 8. Provide an explanation as to why it would be very unlikely that a different sample of size n-30 would produce the same confidence interval. 9. Provide an appropriate statistical interpretation of the 90% confidence interval found in number 7. 10. If a limited amount of federal funds have been allocated to assist jurisdictions whose "percent of low-income working families" exceeds a threshold based on the upper limit of a confidence interval, what would be the effect of using a confidence level that is higher than 90%? 11. If a public official requests funds based on a confidence interval provided by constituents in his/her district, would this raise any ethical concerns, or constitute a misuse of statistics, or both? Provide at least two sentences to respond to the situotion presented. OL 12. Clearly restate the claim associated with this test, and state the null and alternate hypotheses. 13. Provide two or three sentences to state the type of test that should be performed based on the hypotheses. Additionally, state the assumptions and conditions that justify the appropriateness of the test. 14. Use technology to identify, and then provide the test statistic and the resulting P-value associated with the given sample results. Provide a statement that explains the interpretation of the P-value. (Print or copy-and-paste the output that identified these values, or any other form of evidence that technology was used.) 15. State, separately, both the decision/result of the hypothesis test, and the appropriate conclusion/statement about the claim