

Question: TASK # 1 A soil profile is shown below. Calcualte the values of total stress, pore water pressure and effective stress at points A ,
TASK #
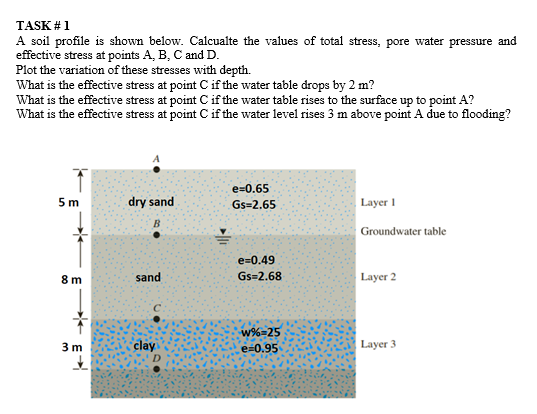
A soil profile is shown below. Calcualte the values of total stress, pore water pressure and
effective stress at points A B C and D
Plot the variation of these stresses with depth.
What is the effective stress at point if the water table drops by
What is the effective stress at point if the water table rises to the surface up to point
What is the effective stress at point if the water level rises above point A due to flooding?
A
yer
roundwater table
yer
tyer
Step by Step Solution
There are 3 Steps involved in it
1 Expert Approved Answer
Step: 1 Unlock

Question Has Been Solved by an Expert!
Get step-by-step solutions from verified subject matter experts
Step: 2 Unlock
Step: 3 Unlock