Question: Task 1: Applying debt rating prediction models to real-life data: Sainsbury [50 marks] Estimate a synthetic credit rating for Sainsburys based on the condensed financial
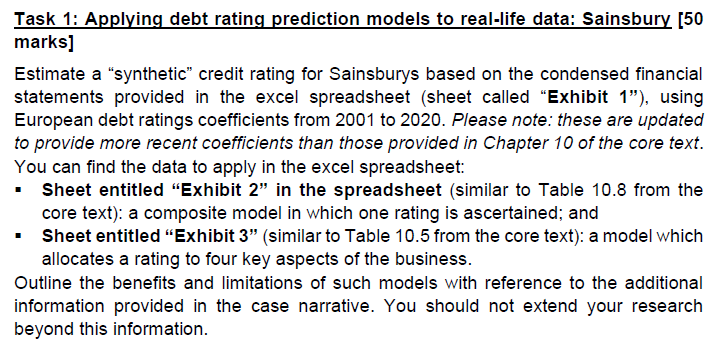
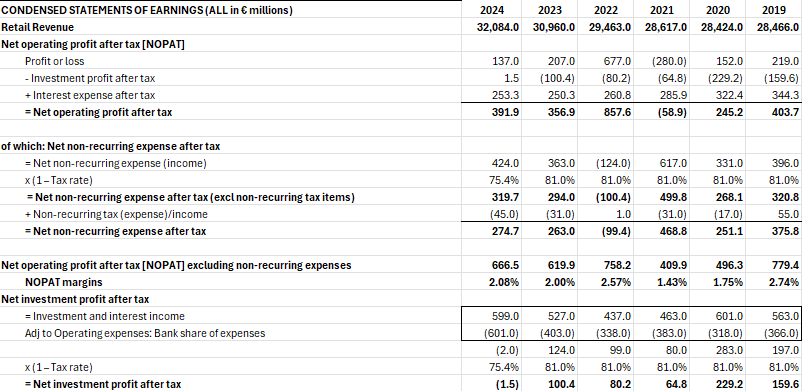
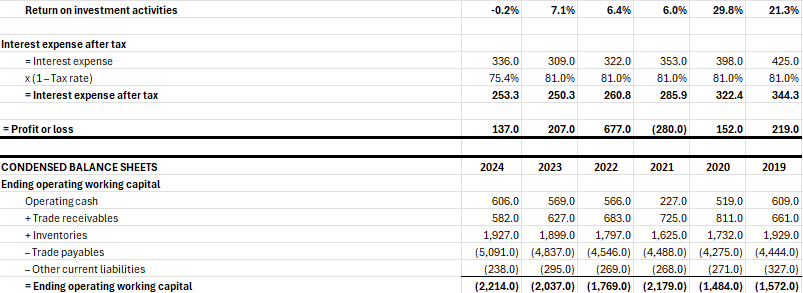
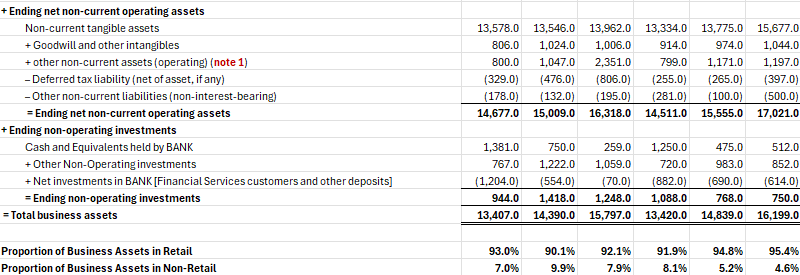
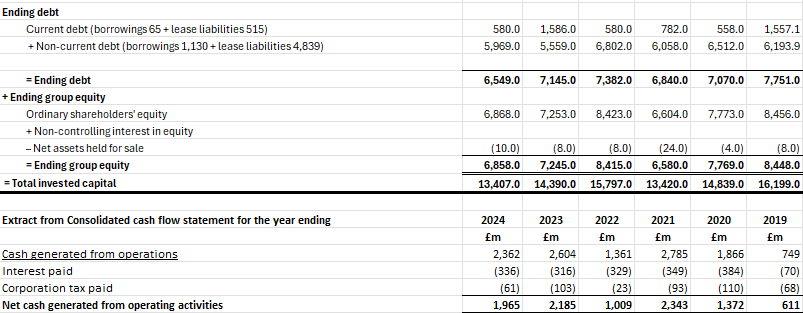
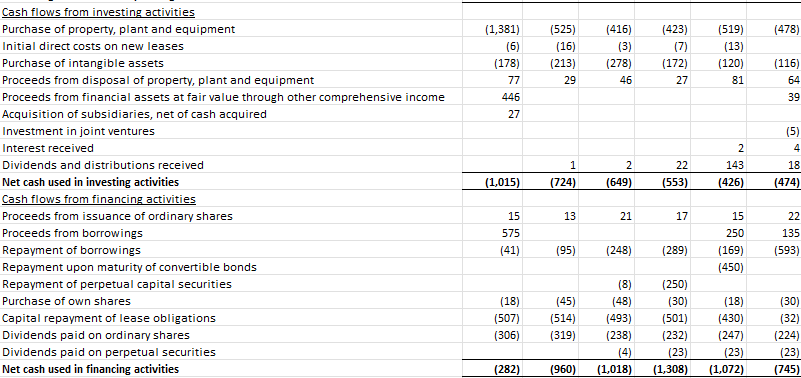
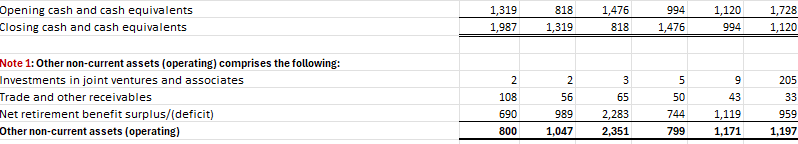
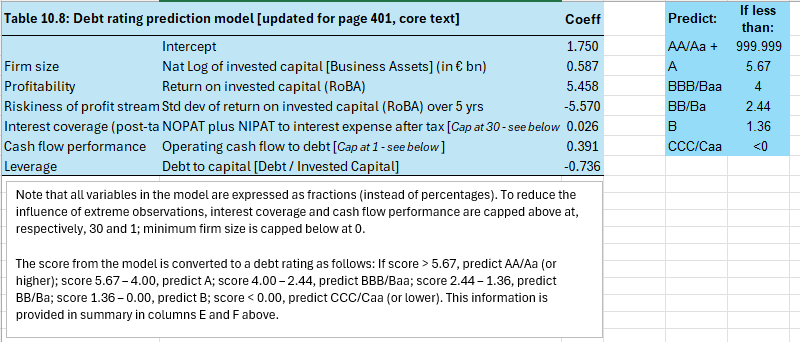
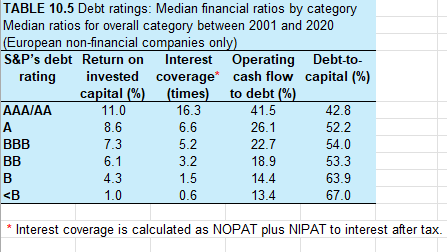
Task 1: Applying debt rating prediction models to real-life data: Sainsbury [50 marks] Estimate a "synthetic\" credit rating for Sainsburys based on the condensed financial statements provided in the excel spreadsheet (sheet called "Exhibit 1%), using European debt ratings coefficients from 2001 to 2020. Please note: these are updated to provide more recent coefficients than those provided in Chapter 10 of the core text. You can find the data to apply in the excel spreadsheet: = Sheet entitled \"Exhibit 2\" in the spreadsheet (similar to Table 10.8 from the core text). a composite model in which one rating is ascertained; and = Sheet entitled \"Exhibit 3\" (similar to Table 10.5 from the core text). a model which allocates a rating to four key aspects of the business. Outline the benefits and limitations of such models with reference to the additional information provided in the case narrative. You should not extend your research beyond this information. CONDENSED STATEMENTS OF EARNINGS ( ALL in ( millions) 2024 2023 2022 2021 2020 2019 Retail Revenue 32,084.0 30,960.0 29.463.0 28,617.0 28,424.0 28,466.0 Net operating profit after tax [NOPAT] Profit or loss 137.0 207.0 677.0 (280.0) 152.0 219.0 - Investment profit after tax 1.5 (100.4) (80.2) (64.8) (229.2) (159.6) + Interest expense after tax 253.3 250.3 260.8 285.9 322.4 344.3 = Net operating profit after tax 391.9 356.9 857.6 (58.9) 245.2 403.7 of which: Net non-recurring expense after tax = Net non-recurring expense (income) 424.0 363.0 (124.0) 617.0 331.0 396.0 x (1- Tax rate) 75.4% 81.0% 81.0% 81.0% 81.0% 81.0% = Net non-recurring expense after tax (excl non-recurring tax items) 319.7 294.0 (100.4) 499.8 268.1 320.8 + Non-recurring tax (expense)/income (45.0) (31.0) 1.0 (31.0) (17.0) 55.0 = Net non-recurring expense after tax 274.7 263.0 (99.4) 468.8 251.1 375.8 Net operating profit after tax [NOPAT] excluding non-recurring expenses 666.5 619.9 758.2 409.9 496.3 779.4 NOPAT margins 2.08% 2.00% 2.57 1.43% 1.75% 2.74% Net investment profit after tax = Investment and interest income 599.0 527.0 437.0 463.0 601.0 563.0 Adj to Operating expenses: Bank share of expenses (601.0) (403.0) (338.0) (383.0) (318.0) (366.0) (2.0) 124.0 99.0 80.0 283.0 197.0 x (1 - Tax rate) 75.4% 81.0% 81.0% 81.0% 81.0% 81.0% = Net investment profit after tax (1.5) 100.4 80.2 64.8 229.2 159.6Return on investment activities -0.2% 7.1% 6.4% 6.0% 29.8% 21.3% Interest expense after tax = Interest expense 336.0 309.0 322.0 353.0 398.0 425.0 x (1 -Tax rate) 75.4% 81.0% 81.0% 81.0% 81.0% 81.0% = Interest expense after tax 253.3 250.3 260.8 285.9 322.4 344.3 = Profit or loss 137.0 207.0 677.0 (280.0) 152.0 219.0 CONDENSED BALANCE SHEETS 2024 2023 2022 2021 2020 2019 Ending operating working capital Operating cash 606.0 569.0 566.0 227.0 519.0 609.0 + Trade receivables 582.0 627.0 683.0 725.0 811.0 661.0 + Inventories 1,927.0 1,899.0 1,797.0 1,625.0 1,732.0 1,929.0 - Trade payables (5,091.0) (4,837.0) (4,546.0) (4,488.0) (4,275.0) (4,444.0) - Other current liabilities (238.0) (295.0) (269.0) (268.0) (271.0) (327.0) = Ending operating working capital (2,214.0) (2,037.0) (1,769.0) (2.179.0) (1,484.0) (1,572.0)+ Ending net non-current operating assets Non-current tangible assets 13,578.0 13,546.0 13,962.0 13,334.0 13,775.0 15,677.0 + Goodwill and other intangibles 806.0 1,024.0 1,006.0 914.0 974.0 1,044.0 + other non-current assets (operating) (note 1) 800.0 1,047.0 2,351.0 799.0 1,171.0 1,197.0 - Deferred tax liability (net of asset, if any) (329.0) (476.0) (806.0) (255.0) (265.0) (397.0) - Other non-current liabilities (non-interest-bearing) (178.0) (132.0) (195.0) (281.0) (100.0) (500.0) = Ending net non-current operating assets 14,677.0 15,009.0 16,318.0 14,511.0 15,555.0 17,021.0 + Ending non-operating investments Cash and Equivalents held by BANK 1,381.0 750.0 259.0 1,250.0 475.0 512.0 + Other Non-Operating investments 767.0 1,222.0 1,059.0 720.0 983.0 852.0 + Net investments in BANK [Financial Services customers and other deposits] (1,204.0) (554.0) (70.0) (882.0) (690.0) (614.0) = Ending non-operating investments 944.0 1,418.0 1,248.0 1,088.0 768.0 750.0 = Total business assets 13,407.0 14,390.0 15,797.0 13,420.0 14,839.0 16,199.0 Proportion of Business Assets in Retail 93.0% 90.1% 92.1% 91.9% 94.8% 95.4% Proportion of Business Assets in Non-Retail 7.0% 9.9% 7.9% 8.1% 5.2% 4.6%Ending debt Current debt (borrowings 65 + lease liabilities 515) 580.0 1,586.0 580.0 782.0 558.0 1,557.1 + Non-current debt (borrowings 1,130 + lease liabilities 4,839) 5,969.0 5,559.0 6,802.0 6,058.0 6,512.0 6,193.9 = Ending debt 6,549.0 7,145.0 7,382.0 6,840.0 7,070.0 7,751.0 + Ending group equity Ordinary shareholders' equity 6,868.0 7,253.0 8,423.0 6,604.0 7,773.0 8,456.0 + Non-controlling interest in equity - Net assets held for sale (10.0) (8.0) (8.0) (24.0) (4.0) (8.0) = Ending group equity 6,858.0 7.245.0 8,415.0 6.580.0 7,769.0 8,448.0 = Total invested capital 13,407.0 14,390.0 15,797.0 13,420.0 14,839.0 16,199.0 Extract from Consolidated cash flow statement for the year ending 2024 2023 2022 2021 2020 2019 Em Em Em Em Em Em Cash generated from operations 2,362 2,604 1,361 2,785 1,866 749 Interest paid (336) (316) (329) (349) (384) (70) Corporation tax paid (61) (103) (23) (93) (110) (68 Net cash generated from operating activities 1,965 2,185 1,009 2,343 1,372 611Cash flows from investing activities Purchase of property, plant and equipment Initial direct costs on new leases Purchase of intangible assets Proceeds from disposal of property, plant and equipment Proceeds from financial assets at fair value through other comprehensive income Acquisition of subsidiaries, net of cash acquired Investment in joint ventures Interest received Dividends and distributions received Met cash used in investing activities Cash flows from financing activities Proceeds from issuance of ordinary shares Proceeds from borrowings Repayment of borrowings Repayment upon maturity of convertible bonds Repayment of perpetual capital securities Furchase of own shares Capital repayment of lease obligations Dividends paid on ordinary shares Dividends paid on perpetual securities Met cash used in financing activities (1,381) (&) (178 77 41 27 [1,015) 15 575 (41) [18) (507) (308) (282) {525) (16) (213) 29 (724) 13 i95) (45) (514) (318) (960 (416) (2 (278) a5 (649) 21 (248) (8) (48) (493} [238) 4 [1018) (423 7 (172} 7 22 (553) 17 (289) (250) [30) (501) (232) [23) (1,308) (518) (13 (120) Bl 143 (426) 15 250 (169) [450) (18) (430) (247} (23) (1,072 (478) (116} 39 (3 18 [474) 22 135 (593) (30) (32) j224) (23) {745) Opening cash and cash equivalents Closing cash and cash equivalents MNote 1: Other non-current assets (operating) comprises the following: Investments in joint ventures and associates Trade and other receivables Met retirement benefit surplus/{deficit) Other non-current assets [operating) 1,319 1,987 108 690 800 B18 1,318 56 939 1,047 1,476 218 5 2,283 2,351 994 1,476 50 744 799 1,120 994 43 1,119 1,171 1,728 1,120 205 33 959 1,197 Table 10.8: Debt rating prediction model [updated for page 401, core text] Coeff Intercept 1.750 Firm size Mat Log of invested capital [Business Assets] (in bn) 0.587 Profitability Return on invested capital (RoBA) 5.458 Riskiness of profit stream Std dev of return on invested capital (RoBA) over 5 yrs -5.570 Interest coverage (post-ta MOPAT plus NIPAT to interest expense after tax [Cap at 30- see below 0.026 Cash flow performance Operating cash flow to debt [Cap at 1 - see below ] 0.391 Leverage Debt to capital [Debt / Invested Capital] -0.736 Mote that all variables in the model are expressed as fractions (instead of percentages). Toreduce the influence of extreme observations, interest coverage and cash flow performance are capped above at, respectively, 30 and 1; minimum firm size is capped below at 0. The score from the model is converted to a debt rating as follows: If score 5.67, predict AAfAa (or higher); score 5.67 - 4.00, predict A; score 4.00 - 2.44, predict BBB/Baa; score 2.44 - 1.36, predict BB/Ba; score 1..36 - 0.00, predict B; score
Step by Step Solution
There are 3 Steps involved in it
1 Expert Approved Answer
Step: 1 Unlock
Question Has Been Solved by an Expert!
Get step-by-step solutions from verified subject matter experts
Step: 2 Unlock
Step: 3 Unlock
Students Have Also Explored These Related Finance Questions!