

Question: Which graph better describes the foreign born population in the US the percent of total line graph or the foreign born population bar paragraph explain
Which graph better describes the foreign born population in the US the percent of total line graph or the foreign born population bar paragraph explain your reasoning.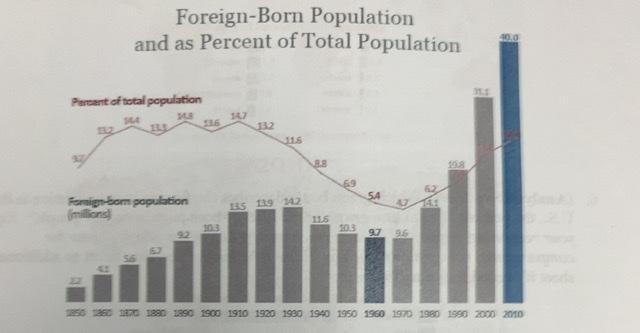
Foreign-Born Population and as Percent of Total Population Pertant of total population 47 132 36 32 116 108 62 43 SA Formign-bom papulation (milions 1S 139 242 14.1 30.3 92 11.6 20.3 97 96 6.7 56 0 1G 1880 1890 1900 1910 1920 1990 1940 1950 1960 1970 1980 1990 2000 2010
Step by Step Solution
★★★★★
3.48 Rating (148 Votes )
There are 3 Steps involved in it
1 Expert Approved Answer
Step: 1 Unlock

Question Has Been Solved by an Expert!
Get step-by-step solutions from verified subject matter experts
Step: 2 Unlock
Step: 3 Unlock