

Question: Task 1: Compute the respective average, standard deviation, and covariance of monthly or daily stock returns. You can pick any two companies to download stock
 Task 1: Compute the respective average, standard deviation, and covariance of monthly or daily stock returns. You can pick any two companies to download stock data for (daily or monthly
Covariance table will be in the form:
| Part 1: Portfolio Return and Risk Compute the portfolio returns and risk measures of a portfolio you create. You can pick any two companies to download stock data for (daily or monthly). For the data you will need to attain about 50 observations (prices and returns for each stock). Task 1: Compute the respective average, standard deviation, and covariance of monthly or daily stock returns. Covariance table will be in the form:
Note: Use STDEV.P in Excel for the standard deviation Task 2: Using the obtained statistics fromQ1, calculate an equal weighted portfolio return and portfolio variance for the first portfolio using the below equations: Equal weighted portfolio return: E(RP) = w1(avg(r1)) + w2(avg(r2)); where w is the weight of each stock in the portfolio. And avg(r1) is the mean return for stock 1 and avg(r2) is the mean return for stock 2. Portfolio variance: 2p = w12( 2s1) + w22( 2s2) + 2*w1 w2 * s1 s2 Task 3: Select two different stocks and repeat task 1 and 2 Again: you can pick any two companies (except the ones you used for part 1) to download stock data for (daily or monthly). For the data you will need to attain about 50 observations (prices and returns for each stock). Task 4: Now using a matrix multiplication (i.e. MMULT in Excel.), compute two portfolio returns and portfolio variances. Use the formula: portfolio return: E(RP) = w * rT portfolio variance: P2 =wwT Task 5: With the either portfolio, create a table that shows the benefit of diversification using Data Table in Excel. (Note that the table shows portfolio returns and portfolio standard deviation with respect to scenarios of weights on one of the stocks of your choosing from the portfolio) Task 6: Using the table obtained from problem 6, Plot expected returns against portfolio risk (standard deviations) displaying efficient portfolios. Task 7: Using the first portfolio, find out optimal weights that minimizes the portfolio standard deviation (Minimum Variance Portfolio). Use the formula (from Slides 6 and 7): P2 =w**wT subject to w*rT =E(RP) | |||||
This is all that is provided, Im not sure where to get data from ?
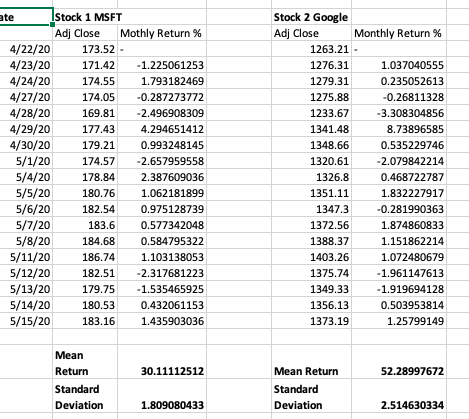
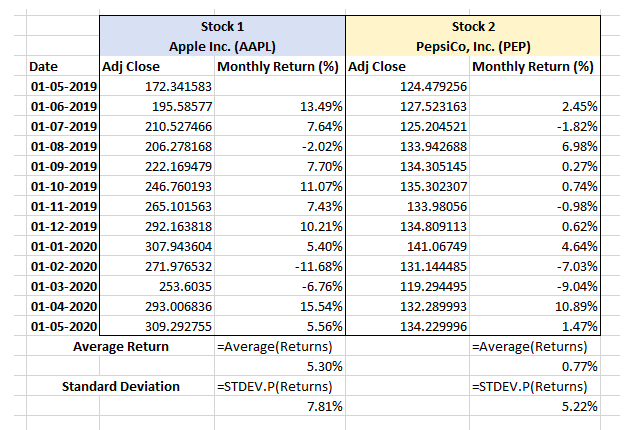
ate Stock 1 MSFT Adj Close Mothly Return% 4/22/20 173.52 - 4/23/20 171.42 -1.225061253 4/24/20 174.55 1.793182469 4/27/20 174.05 -0.287273772 4/28/20 169.81 -2.496908309 4/29/20 177.43 4.294651412 4/30/20 179.21 0.993248145 5/1/20 174.57 -2.657959558 5/4/20 178.84 2.387609036 5/5/20 180.76 1.062181899 5/6/20 182.54 0.975128739 5/7/20 183.6 0.577342048 5/8/20 184.68 0.584795322 5/11/20 186.74 1.103138053 5/12/20 182.51 -2.317681223 5/13/20 179.75 -1.535465925 5/14/20 180.53 0.432061153 5/15/20 183.16 1.435903036 Stock 2 Google Adj Close Monthly Return % 1263.21 - 1276.31 1.037040555 1279.31 0.235052613 1275.88 -0.26811328 1233.67 -3.308304856 1341.48 8.73896585 1348.66 0.535229746 1320.61 -2.079842214 1326.8 0.468722787 1351.11 1.832227917 1347.3 -0.281990363 1372.56 1.874860833 1388.37 1.151862214 1403.26 1.072480679 1375.74 -1.961147613 1349.33 -1.919694128 1356.13 0.503953814 1373.19 1.25799149 Mean Return 30.11112512 52.28997672 Standard Deviation Mean Return Standard Deviation 1.809080433 2.514630334 Stock 1 Stock 2 Apple Inc. (AAPL) PepsiCo, Inc. (PEP) Date Adj Close Monthly Return (%) Adj Close Monthly Return (%) 01-05-2019 172.341583 124.479256 01-06-2019 195.58577 13.49% 127.523163 2.45% 01-07-2019 210.527466 7.64% 125.204521 -1.82% 01-08-2019 206.278168 -2.02% 133.942688 6.98% 01-09-2019 222.169479 7.70% 134.305145 0.27% 01-10-2019 246.760193 11.07% 135.302307 0.74% 01-11-2019 265.101563 7.43% 133.98056 -0.98% 01-12-2019 292.163818 10.21% 134.809113 0.62% 01-01-2020 307.943604 5.40% 141.06749 4.64% 01-02-2020 271.976532 -11.68% 131.144485 -7.03% 01-03-2020 253.6035 -6.76% 119.294495 -9.04% 01-04-2020 293.006836 15.54% 132.289993 10.89% 01-05-2020 309.292755 5.56% 134.229996 1.47% Average Return =Average(Returns) =Average(Returns) 5.30% 0.77% Standard Deviation ESTDEV.P(Returns) =STDEV.P(Returns) 7.81% 5.22% ate Stock 1 MSFT Adj Close Mothly Return% 4/22/20 173.52 - 4/23/20 171.42 -1.225061253 4/24/20 174.55 1.793182469 4/27/20 174.05 -0.287273772 4/28/20 169.81 -2.496908309 4/29/20 177.43 4.294651412 4/30/20 179.21 0.993248145 5/1/20 174.57 -2.657959558 5/4/20 178.84 2.387609036 5/5/20 180.76 1.062181899 5/6/20 182.54 0.975128739 5/7/20 183.6 0.577342048 5/8/20 184.68 0.584795322 5/11/20 186.74 1.103138053 5/12/20 182.51 -2.317681223 5/13/20 179.75 -1.535465925 5/14/20 180.53 0.432061153 5/15/20 183.16 1.435903036 Stock 2 Google Adj Close Monthly Return % 1263.21 - 1276.31 1.037040555 1279.31 0.235052613 1275.88 -0.26811328 1233.67 -3.308304856 1341.48 8.73896585 1348.66 0.535229746 1320.61 -2.079842214 1326.8 0.468722787 1351.11 1.832227917 1347.3 -0.281990363 1372.56 1.874860833 1388.37 1.151862214 1403.26 1.072480679 1375.74 -1.961147613 1349.33 -1.919694128 1356.13 0.503953814 1373.19 1.25799149 Mean Return 30.11112512 52.28997672 Standard Deviation Mean Return Standard Deviation 1.809080433 2.514630334 Stock 1 Stock 2 Apple Inc. (AAPL) PepsiCo, Inc. (PEP) Date Adj Close Monthly Return (%) Adj Close Monthly Return (%) 01-05-2019 172.341583 124.479256 01-06-2019 195.58577 13.49% 127.523163 2.45% 01-07-2019 210.527466 7.64% 125.204521 -1.82% 01-08-2019 206.278168 -2.02% 133.942688 6.98% 01-09-2019 222.169479 7.70% 134.305145 0.27% 01-10-2019 246.760193 11.07% 135.302307 0.74% 01-11-2019 265.101563 7.43% 133.98056 -0.98% 01-12-2019 292.163818 10.21% 134.809113 0.62% 01-01-2020 307.943604 5.40% 141.06749 4.64% 01-02-2020 271.976532 -11.68% 131.144485 -7.03% 01-03-2020 253.6035 -6.76% 119.294495 -9.04% 01-04-2020 293.006836 15.54% 132.289993 10.89% 01-05-2020 309.292755 5.56% 134.229996 1.47% Average Return =Average(Returns) =Average(Returns) 5.30% 0.77% Standard Deviation ESTDEV.P(Returns) =STDEV.P(Returns) 7.81% 5.22%
Step by Step Solution
There are 3 Steps involved in it

Get step-by-step solutions from verified subject matter experts