

Question: Task 1 : Consider the simulation results available in the accompanying Excel file and answer the following questions: ( Answer in one to two sentences.
Task : Consider the simulation results available in the accompanying Excel file and answer the following questions: Answer in one to two sentences.
Why do you think each position Retailer Distributor, Warehouse, and Manufacturer ordered more units than the final customer overall
Why were the ordered quantities not received at the retailer and distributor for several weeks?
What would have happened if the simulation ran for another to weeks?
marks
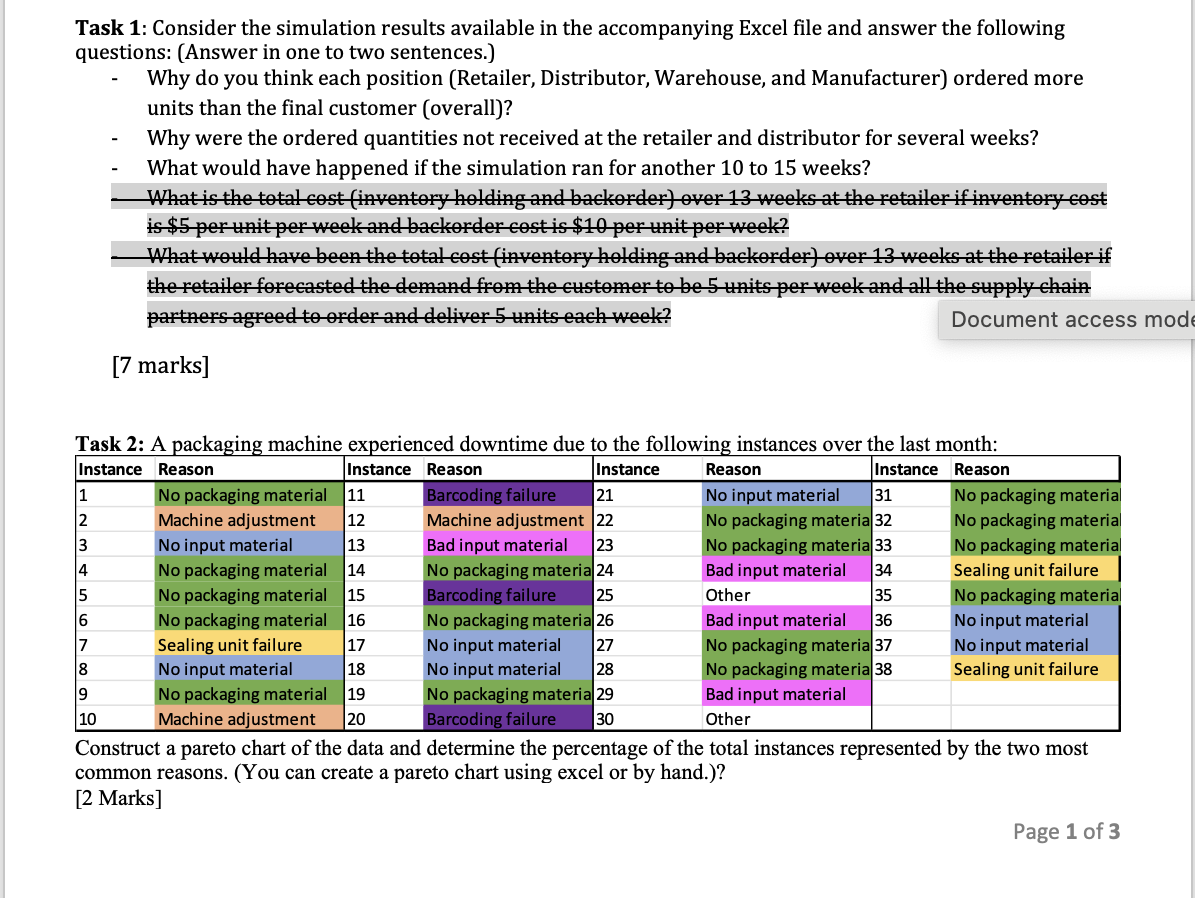
Task : A packaging machine experienced downtime due to the following instances over the last month:
Construct a pareto chart of the data and determine the percentage of the total instances represented by the two most common reasons. You can create a pareto chart using excel or by hand.
Marks
Step by Step Solution
There are 3 Steps involved in it
1 Expert Approved Answer
Step: 1 Unlock

Question Has Been Solved by an Expert!
Get step-by-step solutions from verified subject matter experts
Step: 2 Unlock
Step: 3 Unlock