

Question: Task 1: Using the lCustomer Service C all dataset provided with this assignment. you are to design four different Tableau dashboards with the following specifications:
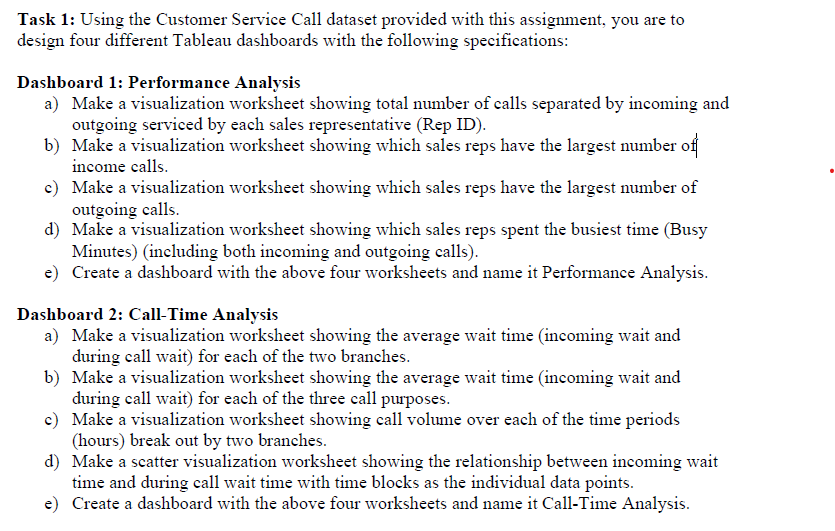


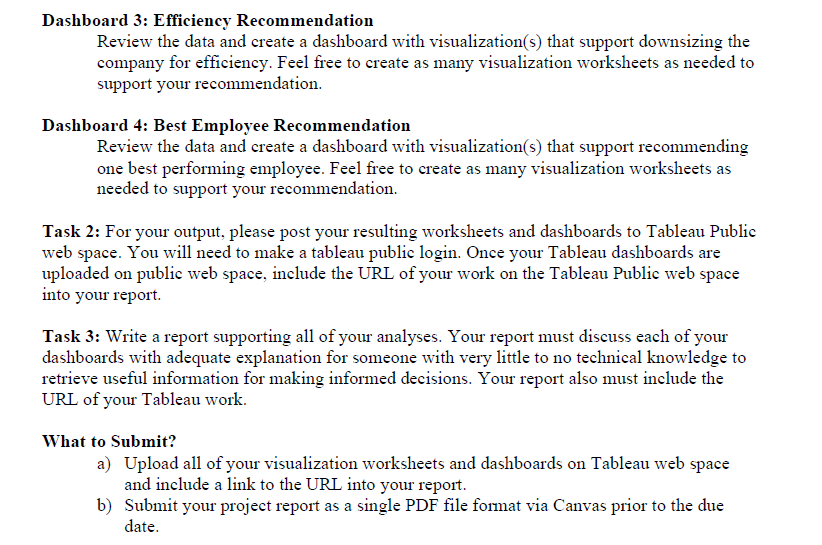
Task 1: Using the lCustomer Service C all dataset provided with this assignment. you are to design four different Tableau dashboards with the following specifications: Dashboard 1: Performance Analysis a} Make a visualization worksheet showing total number of calls separated by incoming and outgoing serviced by each sales representative (Rep ID). b) Make a visualization worksheet showing which sales reps have the largest iunnber oil income calls. c} Make a visualization worksheet showing which sales reps have the largest number of outgoing calls. d) Make a visualization worksheet showing which sales reps spent the busiest time [Busy Minutes) [including both incoming and outgoing calls). e) Create a dashboard with the above four worksheets and name it Performance Analysis. Dashboard 2: CallTime Analysis a} Make a visualization worksheet showing the average wait time {incoming wait and during call wait) for each of the two branches. b) Make a visualization worksheet showing the average wait time (incoming wait and during call wait) for each of the three call purposes. c) Make a visualization worksheet showing call volume over each of the time periods (hours) break out by two branches. d) Make a scatter visualization worksheet showing the relationship between incoming wait time and during call wait time with time blocks as the individual data points. e) Create a dashboard with the above four worksheets and name it Call-Time Analysis. Dashboard 3: Efficiency Recommendation Review the data and create a dashboard with visualization(s) that support downsizing the company for efficiency. Feel free to create as many visualization worksheets as needed to support your recommendation. Dashboard 4: Best Employee Recommendation Review the data and create a dashboard with visualization(s) that support recommending one best performing employee. Feel free to create as many visualization worksheets as needed to support your recommendation. Task 2: For your output, please post your resulting worksheets and dashboards to Tableau Public web space. You will need to make a tableau public login. Once your Tableau dashboards are uploaded on public web space, include the URL of your work on the Tableau Public web space into your report. Task 3: Write a report supporting all of your analyses. Your report must discuss each of your dashboards with adequate explanation for someone with very little to no technical knowledge to retrieve useful information for making informed decisions. Your report also must include the URL of your Tableau work. What to Submit? a) Upload all of your visualization worksheets and dashboards on Tableau web space and include a link to the URL into your report. b) Submit your project report as a single PDF file format via Canvas prior to the due date
Step by Step Solution
There are 3 Steps involved in it

Get step-by-step solutions from verified subject matter experts