Question: Task 1 You have been asked by a Wealth Manager to make a recommendation as to whether the firm should introduce a Socially Responsible Investment
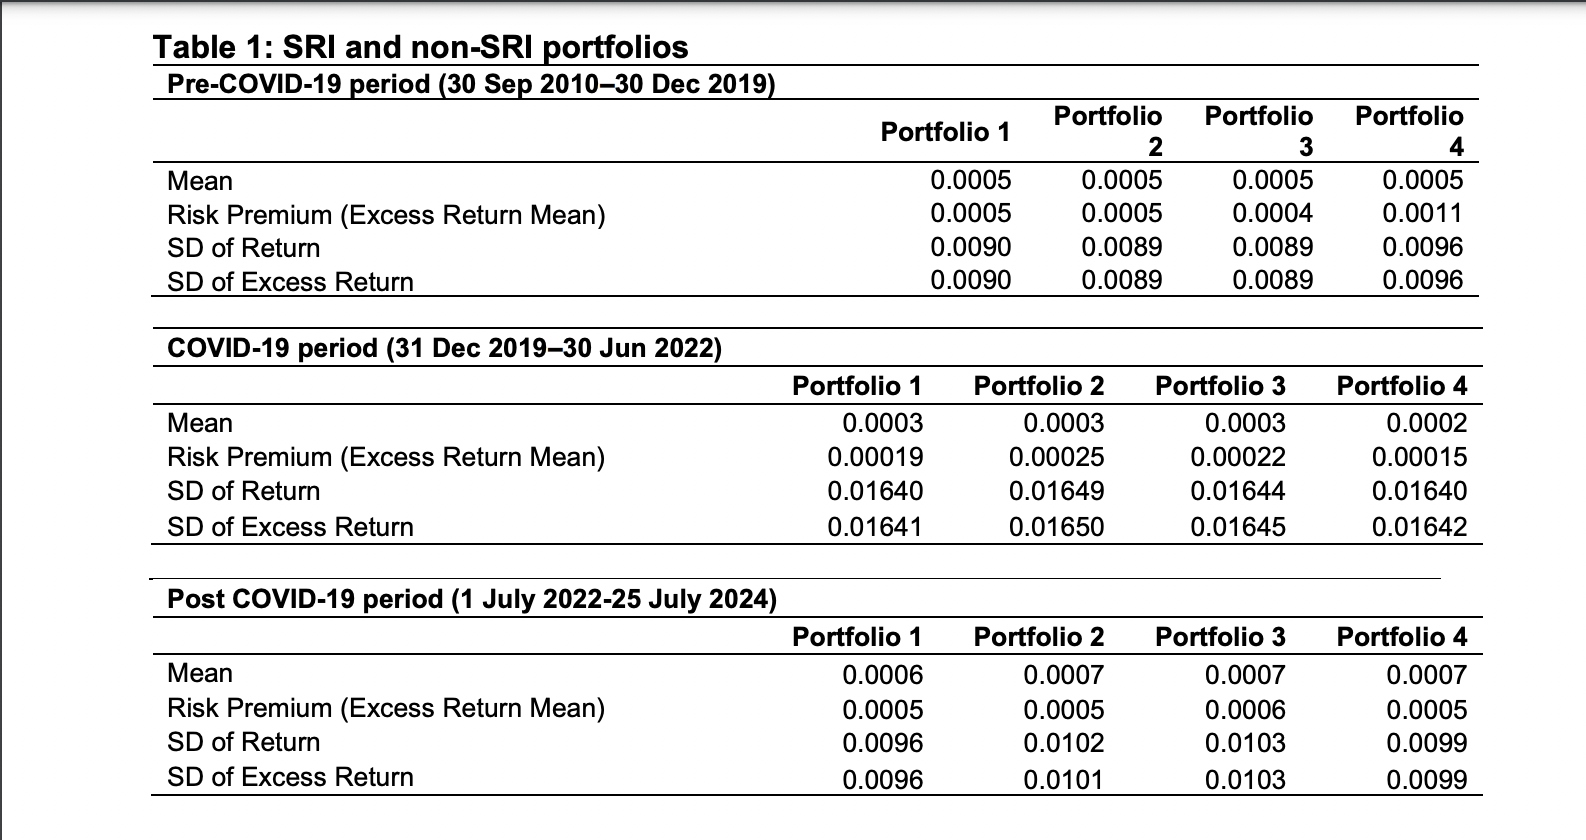
Task 1 You have been asked by a Wealth Manager to make a recommendation as to whether the firm should introduce a Socially Responsible Investment (SRI) product to be included in the portfolio construction, comprising two assets: SRI and Conventional (non-SRI) asset in the context of the COVID-19 crisis. SRI is proxied by S&P500 Environmental & Socially Responsible Index while Conventional (non-SRI) is proxied byS&P500 index. You need to evaluate the performance of the following portfolios during the pre-COVID-19, COVID-19 and post- COVID-19 periods: Portfolio 1: Only conventional (Non-SRI) asset portfolio (100% S&P500 Index) Portfolio 2: Only Socially Responsible Investment (SRI) (100% S&P500 Environmental & Socially Responsible Index) Portfolio 3: A 5050 Portfolio (50% in S&P500 and 50% in S&P500 Environmental & Socially Responsible Index) Portfolio 4: A mean-variance optimised portfolio (Weights in S&P500 and S&P500 Environmental & Socially Responsible Index are optimised) Based on the performance presented in Table 1, which portfolio do you recommend and why?
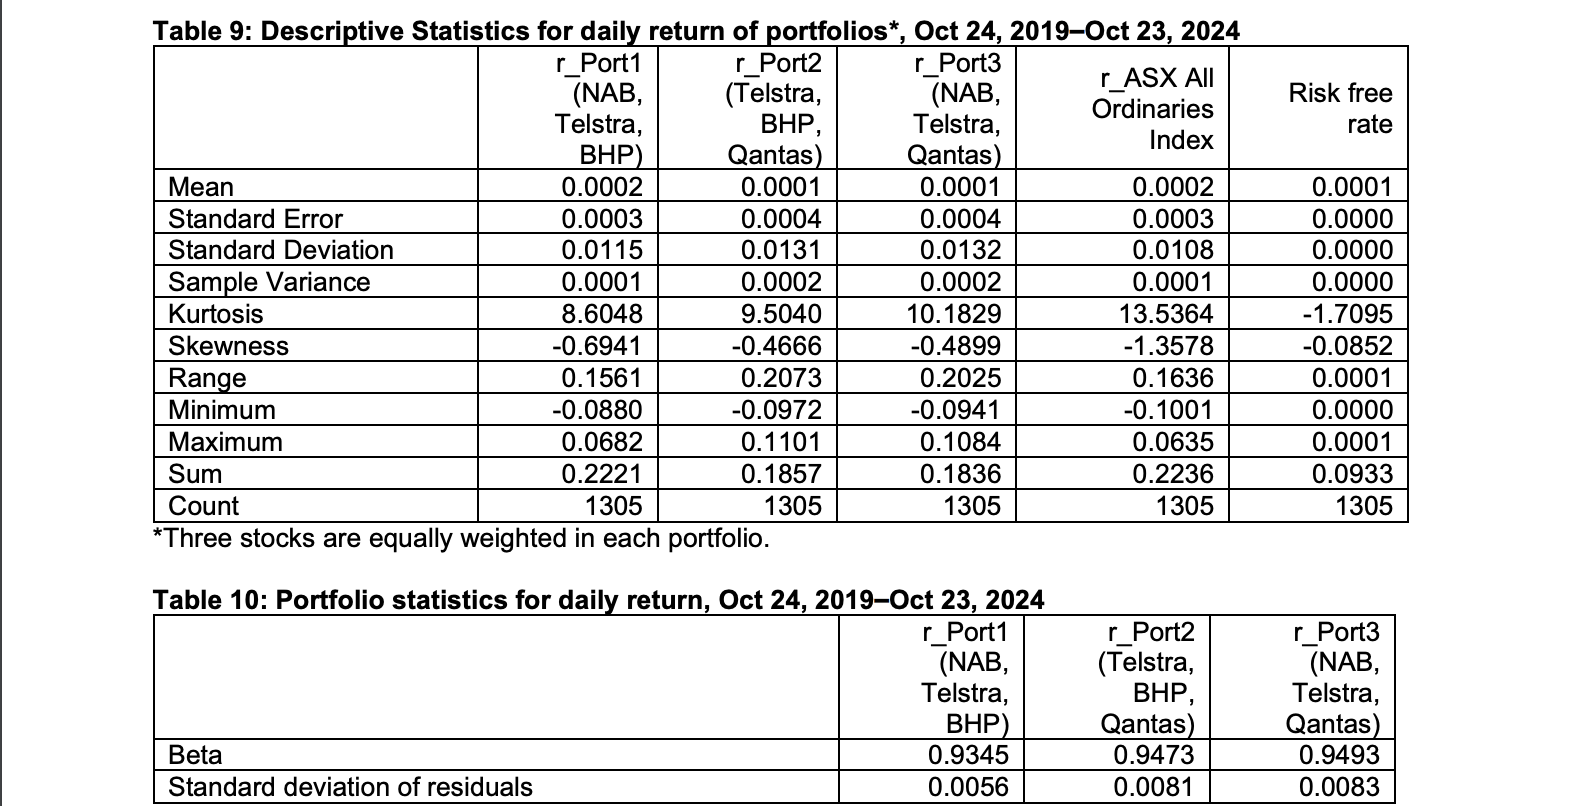
Table 1: SRI and non-SRI portfolios Pre-COVID-19 period (30 Sep 2010-30 Dec 2019) Portfolio 1 Portfolio Portfolio Portfolio 2 3 Mean 0.0005 0.0005 0.0005 0.0005 Risk Premium (Excess Return Mean) 0.0005 0.0005 0.0004 0.0011 SD of Return 0.0090 0.0089 0.0089 0.0096 SD of Excess Return 0.0090 0.0089 0.0089 0.0096 COVID-19 period (31 Dec 2019-30 Jun 2022) Portfolio 1 Portfolio 2 Portfolio 3 Portfolio 4 Mean 0.0003 0.0003 0.0003 0.0002 Risk Premium (Excess Return Mean) 0.00019 0.00025 0.00022 0.00015 SD of Return 0.01640 0.01649 0.01644 0.01640 SD of Excess Return 0.01641 0.01650 0.01645 0.01642 Post COVID-19 period (1 July 2022-25 July 2024) Portfolio 1 Portfolio 2 Portfolio 3 Portfolio 4 Mean 0.0006 0.0007 0.0007 0.0007 Risk Premium (Excess Return Mean) 0.0005 0.0005 0.0006 0.0005 SD of Return 0.0096 0.0102 0.0103 0.0099 SD of Excess Return 0.0096 0.0101 0.0103 0.0099Table 9: Descriptive Statistics for daily return of portfolios*, Oct 24, 2019-Oct 23, 2024 r_Port1 r_Port2 r_Port3 (NAB, (Telstra, (NAB, r ASX All Risk free Telstra, BHP Telstra, Ordinaries rate BHP) Qantas) Qantas) Index Mean 0.0002 0.0001 0.0001 0.0002 0.0001 Standard Error 0.0003 0.0004 0.0004 0.0003 0.0000 Standard Deviation 0.0115 0.0131 0.0132 0.0108 0.0000 Sample Variance 0.0001 0.0002 0.0002 0.0001 0.0000 Kurtosis 8.6048 9.5040 10. 1829 13.5364 -1.7095 Skewness -0.6941 -0.4666 -0.4899 -1.3578 -0.0852 Range 0. 1561 0.2073 0.2025 0. 1636 0.0001 Minimum -0.0880 -0.0972 -0.0941 -0. 1001 0.0000 Maximum 0.0682 0.1101 0. 1084 0.0635 0.0001 Sum 0.2221 0. 1857 0.1836 0.2236 0.0933 Count 1305 1305 1305 1305 1305 *Three stocks are equally weighted in each portfolio. Table 10: Portfolio statistics for daily return, Oct 24, 2019-Oct 23, 2024 r Port1 r Port2 r Port3 (NAB, (Telstra, (NAB, Telstra, BHP, Telstra, BHP) Qantas) Qantas) Beta 0.9345 0.9473 0.9493 Standard deviation of residuals 0.0056 0.0081 0.0083
Step by Step Solution
There are 3 Steps involved in it
1 Expert Approved Answer
Step: 1 Unlock
Question Has Been Solved by an Expert!
Get step-by-step solutions from verified subject matter experts
Step: 2 Unlock
Step: 3 Unlock
Students Have Also Explored These Related Finance Questions!