

Question: Task 2 . 1 Let the signal x ( t ) = s i n ( 2 f t ) with f = 5 H
Task
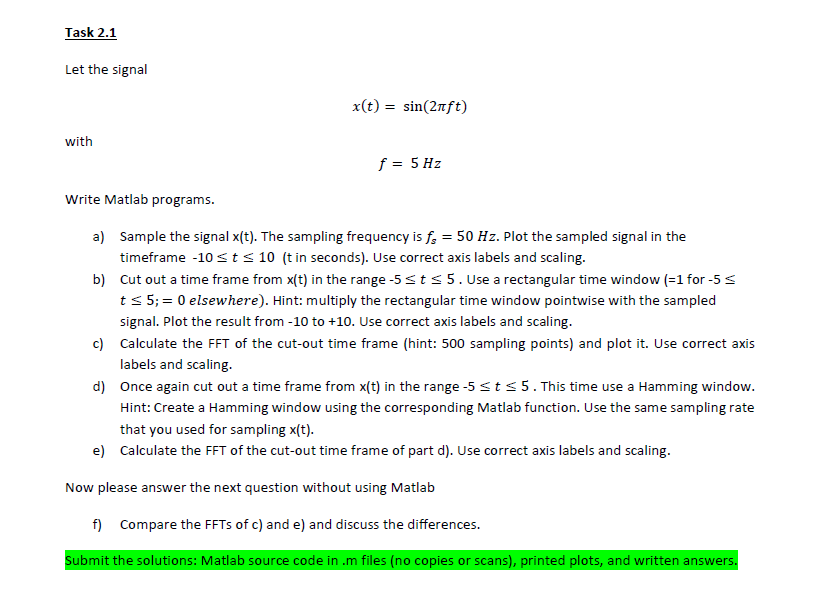
Let the signal
with
Write Matlab programs.
a Sample the signal The sampling frequency is Plot the sampled signal in the
timeframe in seconds Use correct axis labels and scaling.
b Cut out a time frame from in the range Use a rectangular time window for
; elsewhere Hint: multiply the rectangular time window pointwise with the sampled
signal. Plot the result from to Use correct axis labels and scaling.
c Calculate the FFT of the cutout time frame hint: sampling points and plot it Use correct axis
labels and scaling.
d Once again cut out a time frame from in the range This time use a Hamming window.
Hint: Create a Hamming window using the corresponding Matlab function. Use the same sampling rate
that you used for sampling
e Calculate the FFT of the cutout time frame of part d Use correct axis labels and scaling.
Now please answer the next question without using Matlab
f Compare the FFTs of c and e and discuss the differences.
Submit the solutions: Matlab source code in m files no copies or scans printed plots, and written answers.
Step by Step Solution
There are 3 Steps involved in it
1 Expert Approved Answer
Step: 1 Unlock

Question Has Been Solved by an Expert!
Get step-by-step solutions from verified subject matter experts
Step: 2 Unlock
Step: 3 Unlock