

Question: TASK 2: Develop the StressfStrain Curve 1 18 25 min! The stress-strain curve can be modeled using the tensile test data and three theoretical curves.
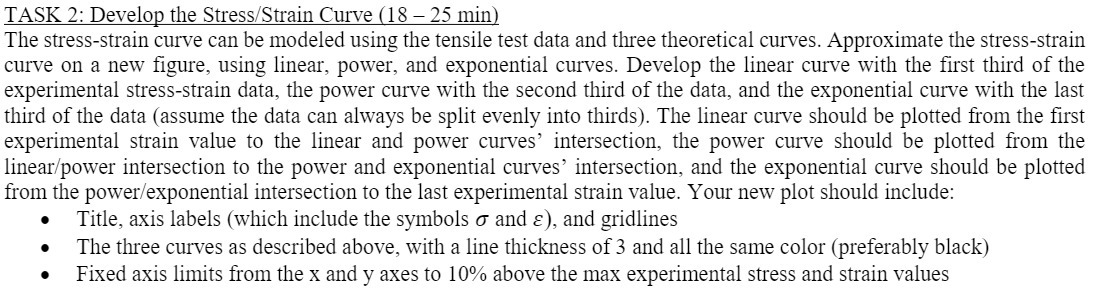
TASK 2: Develop the StressfStrain Curve 1 18 25 min! The stress-strain curve can be modeled using the tensile test data and three theoretical curves. Approximate the stress-strain curve on a new gure, using linear, power, and exponential curves. Develop the linear curve with the rst third of the experimental stress-strain data, the power curve with the second third of the data, and the exponential curve with the last third of the data (assume the data can always be split evenly into thirds). The linear curve should be plotted from the rst experimental strain value to the linear and power curves\" intersection, the power curve should be plotted from the lineari'power intersection to the power and exponential curves\" intersection, and the exponential curve should be plotted from the powerfexponential intersection to the last experimental strain value. Your new plot should include: 0 Title, axis labels (which include the symbols 0' and e), and gridlines o The three curves as described above, with a line thickness of 3 and all the same color (preferably black) 0 Fixed axis limits from the x and y axes to 10% above the max experimental stress and strain values
Step by Step Solution
There are 3 Steps involved in it

Get step-by-step solutions from verified subject matter experts