

Question: A four - legged intersection, as shown in Figure 4 , operates under a fixed time signal system. The phase diagram ( Figure 5 )
A fourlegged intersection, as shown in Figure operates under a fixed time signal system. The
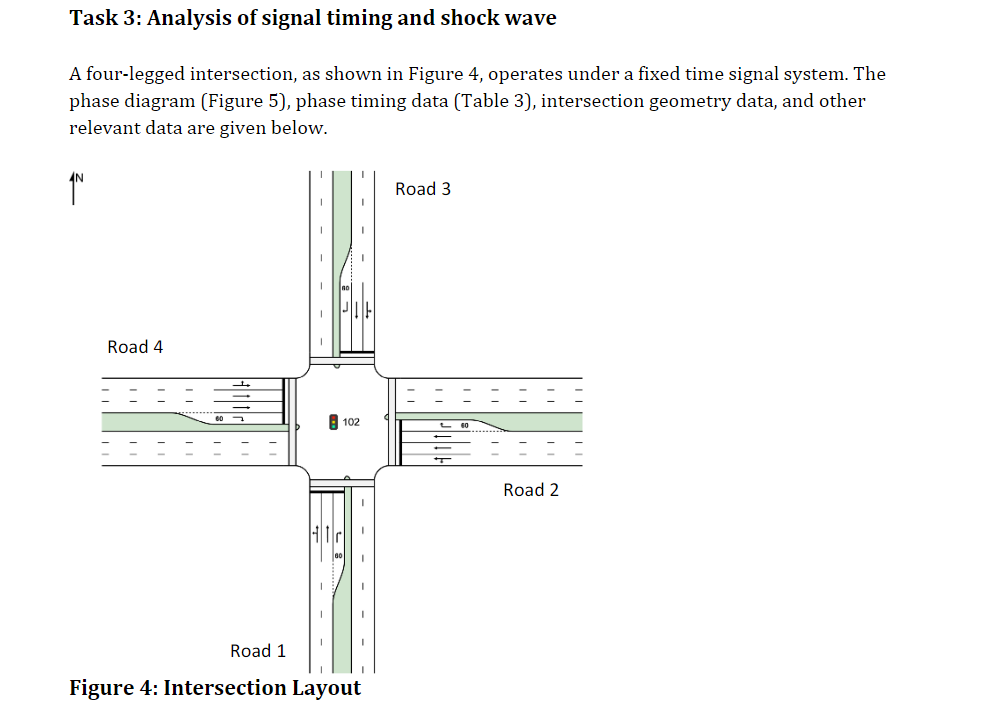
phase diagram Figure phase timing data Table intersection geometry data, and other
relevant data are given below.
Figure : Intersection Layout. Intersection geometry and other data:
Posted speed limit on all roads:
Roads and are wide. Roads and are wide.
Right turn lanes are long
Pedestrian crosswalks on all approaches have ft effective crosswalk width, where
is the last digit of your student number.
Average walking speed of pedestrians
Estimated maximum number of pedestrians crossing any of the four approaches is
per phase
Figure : Traffic signal phasingT Table : Traffic signal timing data
Task Part A:
For the given information above, determine the total lost time in a week. Comment on strategies
to reduce this lost time.
Report results with detailed calculation steps in your report. Note any assumptions made with
justification.
Task Part B:
In addition to the information provided in Part A consider that the below information is known
for the Road approach.
Average speed of and average flow of
Jam density of
Saturation flow of with corresponding density of
Showing detailed calculations, compute the following:
i Speed of the frontal stationary shockwave at the Road approach
ii Speed of the backward recovery shockwave as vehicles start moving at green light
on Road approach
iii. Compute the queue length at a time point when the queue is dissipated on Road
approach.ask : Analysis of signal timing and shock wave
TAKE X VALUE AS
Step by Step Solution
There are 3 Steps involved in it
1 Expert Approved Answer
Step: 1 Unlock

Question Has Been Solved by an Expert!
Get step-by-step solutions from verified subject matter experts
Step: 2 Unlock
Step: 3 Unlock