

Question: Task 4: Analyzing traffic light wait times 4. Using the data from Task 3, the standard deviation is 61 s and the mean wait time
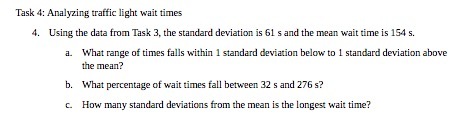
Task 4: Analyzing traffic light wait times 4. Using the data from Task 3, the standard deviation is 61 s and the mean wait time is 154 s. a. What range of times falls within 1 standard deviation below to 1 standard deviation above the mean? b. What percentage of wait times fall between 32 s and 276 s? c. How many standard deviations from the mean is the longest wait time
Step by Step Solution
There are 3 Steps involved in it
1 Expert Approved Answer
Step: 1 Unlock

Question Has Been Solved by an Expert!
Get step-by-step solutions from verified subject matter experts
Step: 2 Unlock
Step: 3 Unlock