

Question: Task 4 : SPC Case: The following CONTROL CHART from a production process was submitted for analysis: Tasks: a ) Assess the process shown in
Task : SPC
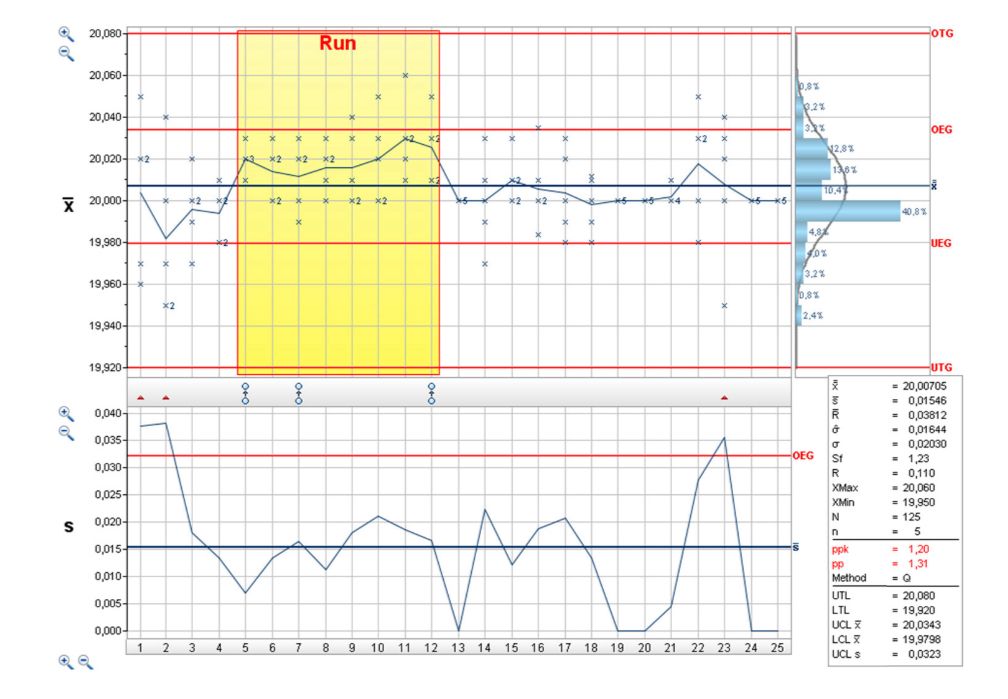
Case: The following CONTROL CHART from a production process was submitted for analysis:
Tasks:
a Assess the process shown in the chart by answering the following questions. Please provide explanations for each answer:
Is the process stable? Is the process capable?
b The control chart shows abnormalities that indicate irregularities in the test data. What are the abnormalities and what irregularities could be the cause?
c Let us assume that it would be possible to change the position of the process mean without great technical effort, eg by changing the tool settings. Please explain each answer.
Could this improve the capability of the process?
What is the highest possible value of the capability index?
Could this approach improve the stability of the process?
Step by Step Solution
There are 3 Steps involved in it
1 Expert Approved Answer
Step: 1 Unlock

Question Has Been Solved by an Expert!
Get step-by-step solutions from verified subject matter experts
Step: 2 Unlock
Step: 3 Unlock