

Question: Task 6- research question and ANOVA test attached. please be thorough in explanation Descriptives Father's age (yrs) 95% Confidence Interval for Mean N Mean Std.
Task 6- research question and ANOVA test attached. please be thorough in explanation
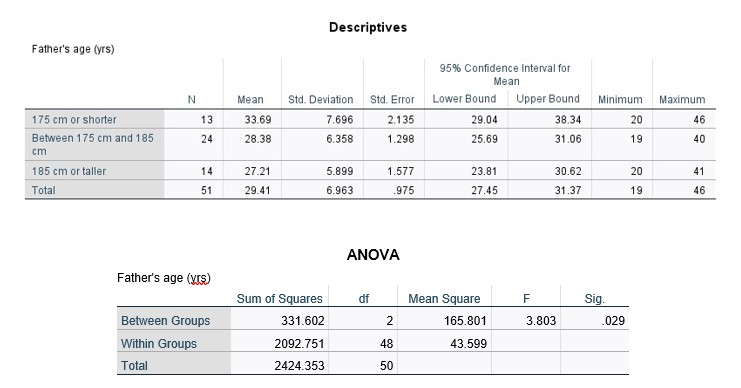
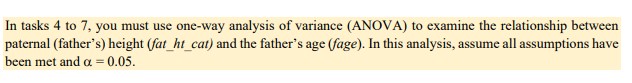
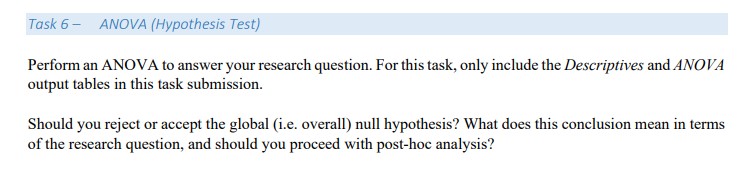
Descriptives Father's age (yrs) 95% Confidence Interval for Mean N Mean Std. Deviation Std. Error Lower Bound Upper Bound Minimum Maximum 175 cm or shorter 13 33.69 7.696 2.135 29.04 38.34 20 46 Between 175 cm and 185 24 28.38 6.358 1.298 25.69 31.06 19 40 cm 185 cm or taller 14 27.21 5.899 1.577 23.81 30.62 20 41 Total 51 29.41 6.963 975 27.45 31.37 19 46 ANOVA Father's age (yrs) Sum of Squares of Mean Square F Sig. Between Groups 331.602 2 165.801 3.803 029 Within Groups 2092.751 48 43.599 Total 2424.353 50In tasks 4 to 7, you must use one-way analysis of variance (ANOVA) to examine the relationship between paternal (father's) height (far_hr car) and the father's age (fage). In this analysis, assume all assumptions have been met and a = 0.05.Task 6- ANOVA (Hypothesis Test) Perform an ANOVA to answer your research question. For this task, only include the Descriptives and ANOVA output tables in this task submission. Should you reject or accept the global (i.e. overall) null hypothesis? What does this conclusion mean in terms of the research question, and should you proceed with post-hoc analysis
Step by Step Solution
There are 3 Steps involved in it

Get step-by-step solutions from verified subject matter experts