

Question: + Task By using the excel spreadsheet, compute the expected return and standard deviation of the returns on a portfolio that is invested in stocks
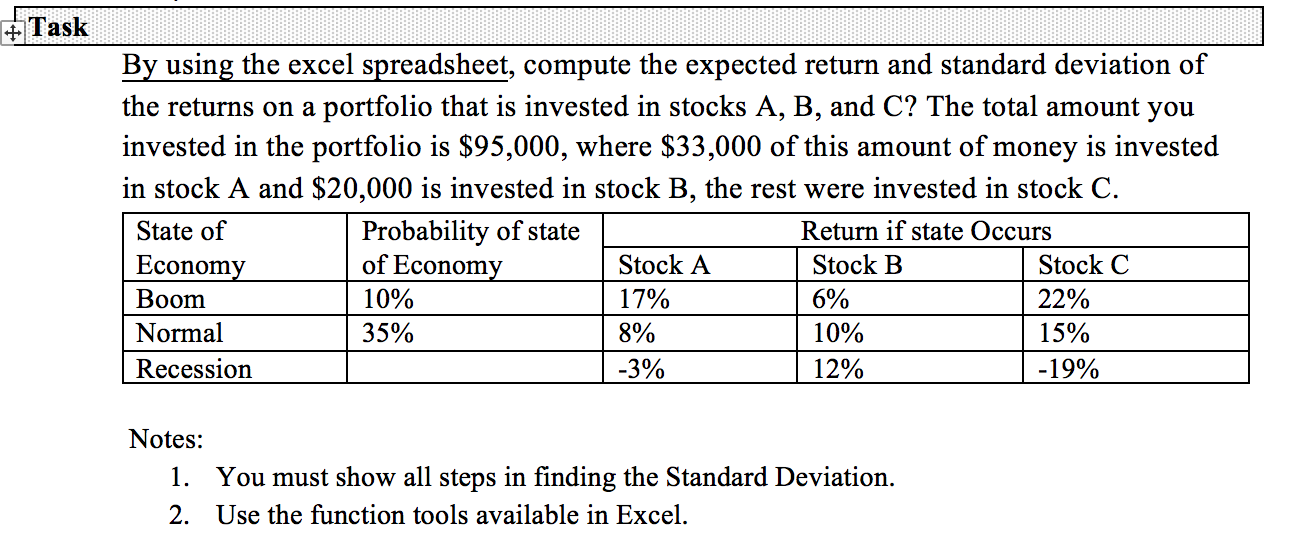
+ Task By using the excel spreadsheet, compute the expected return and standard deviation of the returns on a portfolio that is invested in stocks A, B, and C? The total amount you invested in the portfolio is $95,000, where $33,000 of this amount of money is invested in stock A and $20,000 is invested in stock B, the rest were invested in stock C. State of Probability of state Return if state Occurs Economy of Economy Stock A Stock B Stock C Boom 10% 17% 6% 22% Normal 35% 8% 10% 15% Recession -3% 12% -19% Notes: 1. You must show all steps in finding the Standard Deviation. 2. Use the function tools available in Excel
Step by Step Solution
There are 3 Steps involved in it
1 Expert Approved Answer
Step: 1 Unlock

Question Has Been Solved by an Expert!
Get step-by-step solutions from verified subject matter experts
Step: 2 Unlock
Step: 3 Unlock