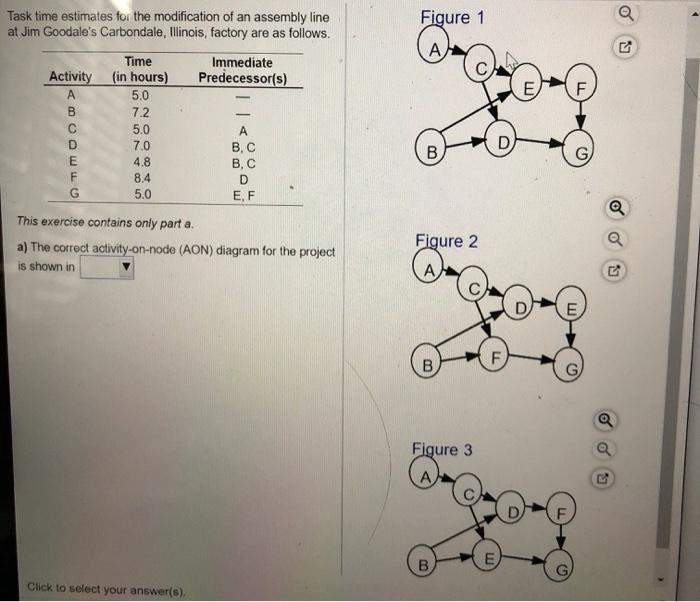
Question: Task time estimates for the modification of an assembly line at Jim Goodale's Carbondale, Illinois, factory are as follows. Figure 1 A Immediate Predecessor(s) Time

Task time estimates for the modification of an
Task time estimates for the modification of an assembly line at Jim Goodale's Carbondale, Illinois, factory are as follows. Figure 1 A Immediate Predecessor(s) Time Activity (in hours) A 5.0 7.2 5.0 7.0 4.8 8.4 G 5.0 6 B A BC B,C D EF This exercise contains only part a. a) The correct activity-on-node (AON) diagram for the project is shown in Figure 2 A D E B Figure 3 ) F B E Click to select your answer(s). Consider the following actual (A) and forecast (F) demand levels for a product. Time Period Actual Demand t A 1 55.0 2 42.0 3 60.0 4 47.0 5 Forecast Demand F 55.00 55.00 51.75 53.81 ? The first forecast, F, was derived by observing A, and setting F, equal to A,. Subsequent forecasts were derived by exponential smoothing. The smoothing constant (a) used to derive the subsequent forecasts = (Round your response to two decimal places) (Hint: To determine a, use either the relationship for period 3 or 4) Using exponential smoothing, the forecasted demand for period 5 using the smoothing constant determined above = (Round your response to one decimal place.)

Step by Step Solution

There are 3 Steps involved in it

1 Expert Approved Answer
Step: 1 Unlock blur-text-image
Question Has Been Solved by an Expert!

Get step-by-step solutions from verified subject matter experts

Step: 2 Unlock
Step: 3 Unlock

Students Have Also Explored These Related General Management Questions!