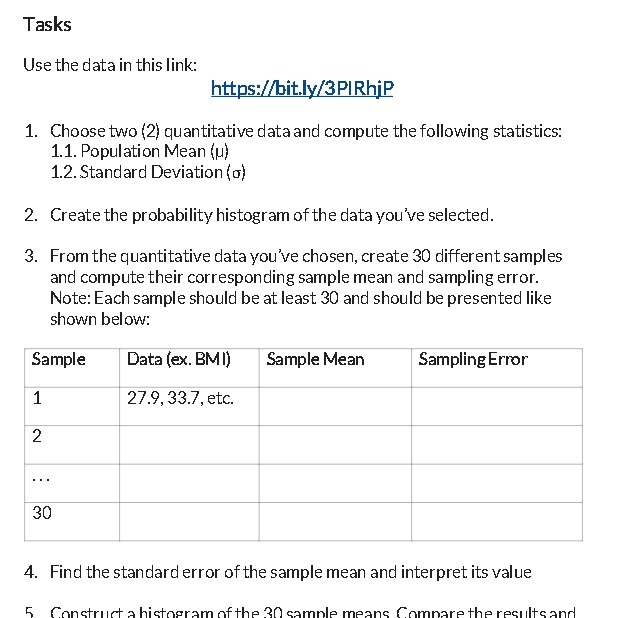
Question: Tasks Use the data in this link: https://bit.ly/3PIRhjp 1. Choose two (2) quantitative data and compute the following statistics: 1.1. Population Mean () 1.2. Standard

Tasks Use the data in this link:
Tasks Use the data in this link: https://bit.ly/3PIRhjp 1. Choose two (2) quantitative data and compute the following statistics: 1.1. Population Mean () 1.2. Standard Deviation (o) 2. Create the probability histogram of the data you've selected. 3. From the quantitative data you've chosen, create 30 different samples and compute their corresponding sample mean and sampling error. Note: Each sample should be at least 30 and should be presented like shown below: Sample Data (ex. BMI) Sample Mean Sampling Error 1 27.9, 33.7, etc. 2 . . . 30 4. Find the standard error of the sample mean and interpret its value Construct = histogram of the 20 sample means I Compare the results and

Step by Step Solution

There are 3 Steps involved in it

1 Expert Approved Answer
Step: 1 Unlock blur-text-image
Question Has Been Solved by an Expert!

Get step-by-step solutions from verified subject matter experts

Step: 2 Unlock
Step: 3 Unlock

Students Have Also Explored These Related Mathematics Questions!