

Question: - - TE 1 D35 xfx H Total B D E G 1 Problem 9 - FINAL PROBLEM (35 points) And a Bar Chart 2
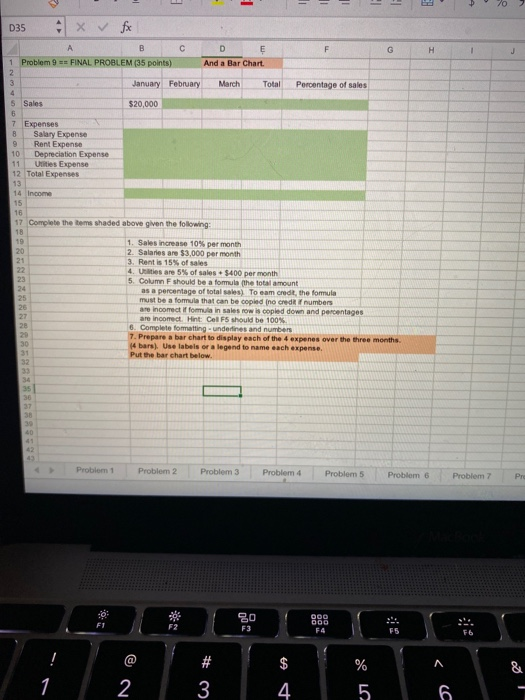
- - TE 1 D35 xfx H Total B D E G 1 Problem 9 - FINAL PROBLEM (35 points) And a Bar Chart 2 3 January February March Porcentage of sales 4 S Sales $20,000 6 7 Expenses 8 Salary Expense 9 Rent Expense 10 Depreciation Expense 11 Urities Expense 12 Total Expenses 13 14 Income 15 16 17 Complete the items shaded above given the following: 18 19 1. Sales increase 10% per month 20 2. Salaries are $3,000 per month 21 3. Rent is 15% of sales 4. Utilities are 5% of sales + $400 per month 23 5. Column F should be a formula the total amount 24 as a percentage of total sales) To cam credit the fomula 25 must be a formula that can be copied no creder numbers 25 are incorrect if formula in sales row is copied down and percentages 27 are incorrect. Hint: Call FS should be 100% 6. Complete fomatting - underlines and numbers 7. Prepare a bar chart to display each of the 4 expenes over the three months. 30 (4 bars). Use labels or a legend to name each expense. Put the bar chart below. 32 33 34 35 30 37 38 39 40 Problem 1 Problem 2 Problem 3 Problem 4 Problem 5 Problem Problem 7 Pre F1 F2 80 F3 000 000 F4 F5 F6 @ $ % A & # 3 1 2 4 5 6
Step by Step Solution
There are 3 Steps involved in it

Get step-by-step solutions from verified subject matter experts