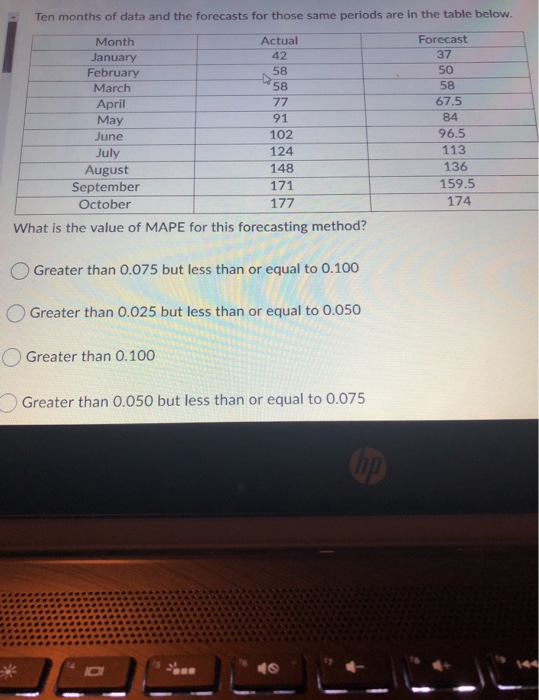
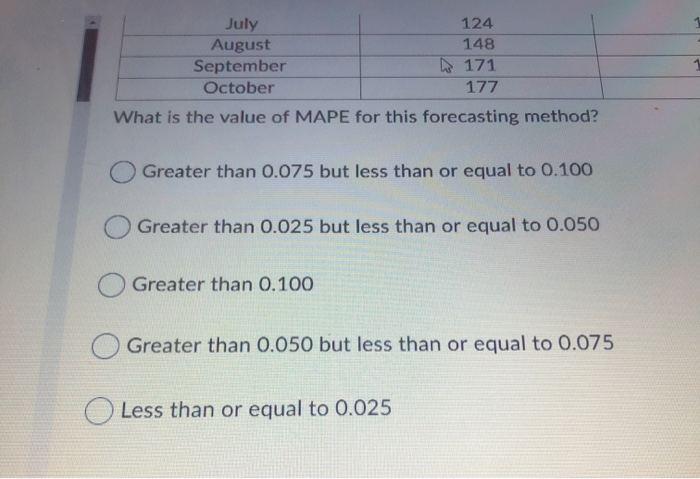
Question: Ten months of data and the forecasts for those same periods are in the table below. Month Actual January 42 February 58 March 58 April

Ten months of data and the forecasts for those
Ten months of data and the forecasts for those same periods are in the table below. Month Actual January 42 February 58 March 58 April 77 May 91 June 102 July 124 August 148 September 171 October 177 What is the value of MAPE for this forecasting method? Forecast 37 50 58 67.5 84 96.5 113 136 159.5 174 Greater than 0.075 but less than or equal to 0.100 Greater than 0.025 but less than or equal to 0.050 Greater than 0.100 Greater than 0.050 but less than or equal to 0.075 Chp IO July 124 August 148 September 171 October 177 What is the value of MAPE for this forecasting method? Greater than 0.075 but less than or equal to 0.100 Greater than 0.025 but less than or equal to 0.050 Greater than 0.100 Greater than 0.050 but less than or equal to 0.075 Less than or equal to 0.025 The manager of a pizza shop must forecast weekly demand for special pizzas so that he can order pizza shells weekly. Recent demand has been: Week 1 2 3 4 5 Number of Special Pizzas 365 380 439 412 467 Use the information in the table above. What is the forecast for Week 6 if the 3- week weighted moving average method is used? (Use weights of 0.5 for the most recent demand, 0.3, and 0.2 for the oldest demand.) Fewer than or equal to 432 units Greater than 452 units but fewer than or equal to 462 units Greater than 432 units but fewer than or equal to 442 units Greater than 462 units Greater than 442 units but fewer than or equal to 452 units

Step by Step Solution

There are 3 Steps involved in it

1 Expert Approved Answer
Step: 1 Unlock blur-text-image
Question Has Been Solved by an Expert!

Get step-by-step solutions from verified subject matter experts

Step: 2 Unlock
Step: 3 Unlock

Students Have Also Explored These Related General Management Questions!