

Question: Test POST UNIT 8 - TEST - Ch. 4 Question 1 This Test: 12 pts possible For the accompanying data set, (a) draw a scatter
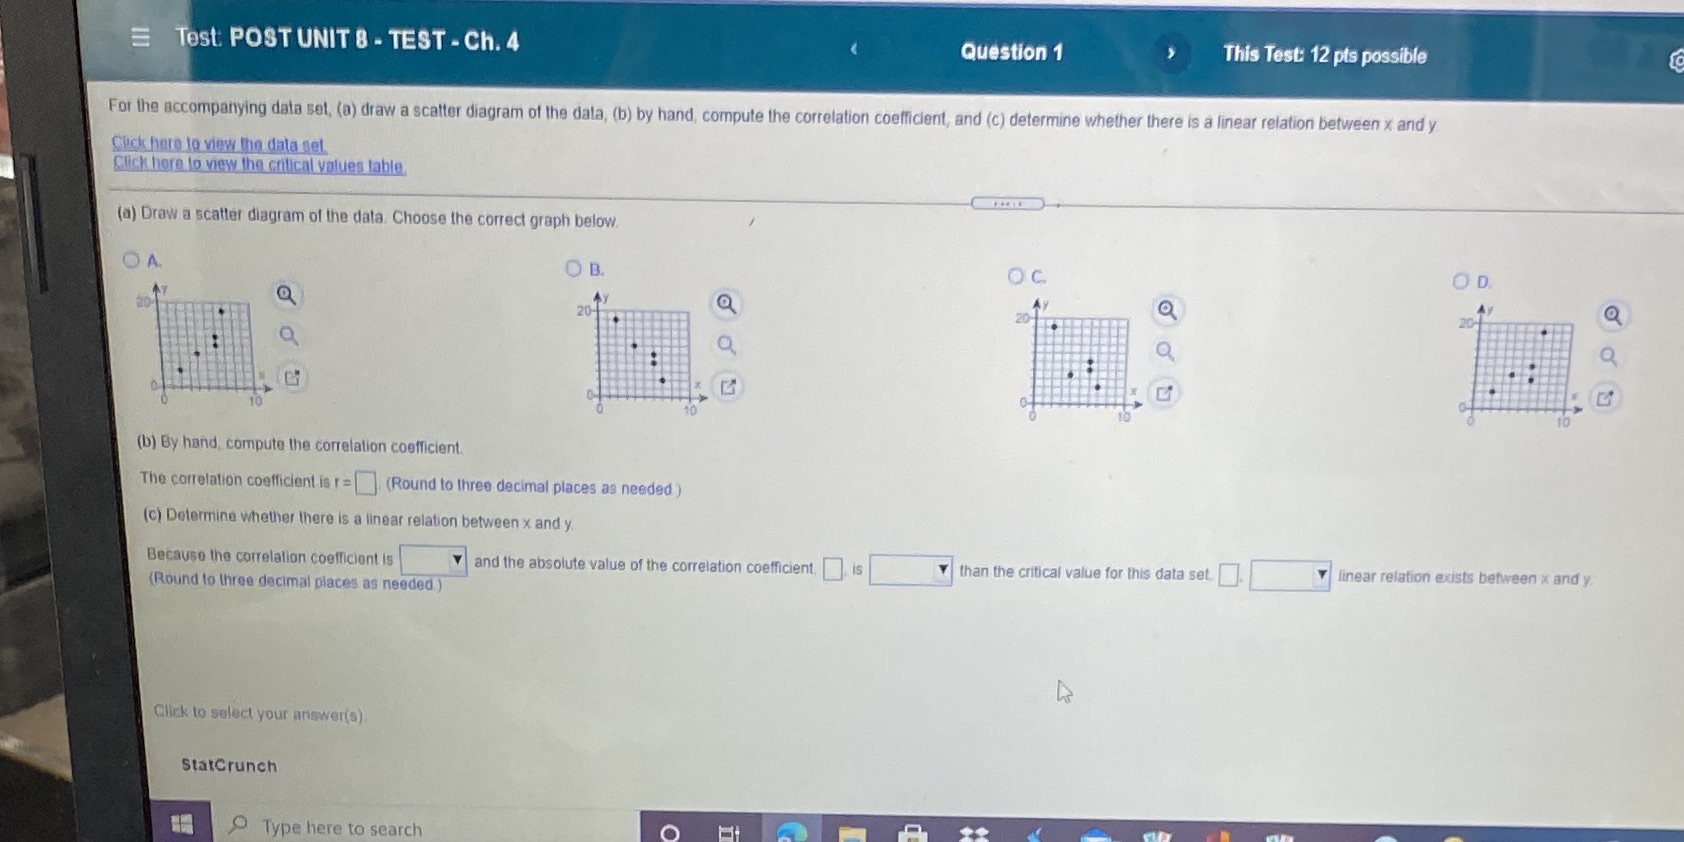
Test POST UNIT 8 - TEST - Ch. 4 Question 1 This Test: 12 pts possible For the accompanying data set, (a) draw a scatter diagram of the data, (b) by hand, compute the correlation coefficient, and (c) determine whether there is a linear relation between x and y Click here to view tho data get Click here to view the critical values table (a) Draw a scatter diagram of the data. Choose the correct graph below. OA O B. OC OD 20- 20 a 20- a O Q (b) By hand, compute the correlation coefficient. The correlation coefficient is r= [ ] (Round to three decimal places as needed ) (c) Determine whether there is a linear relation between x and y Because the correlation coefficient is and the absolute value of the correlation coefficient, , is than the critical value for this data set. linear relation exists between x and y (Round to three decimal places as needed ) Click to select your answers) statCrunch Type here to search O
Step by Step Solution
There are 3 Steps involved in it

Get step-by-step solutions from verified subject matter experts