

Question: Bivariate data for the guantitative variables x and y are given in the table below. These data are plotted in the scatter plot shown
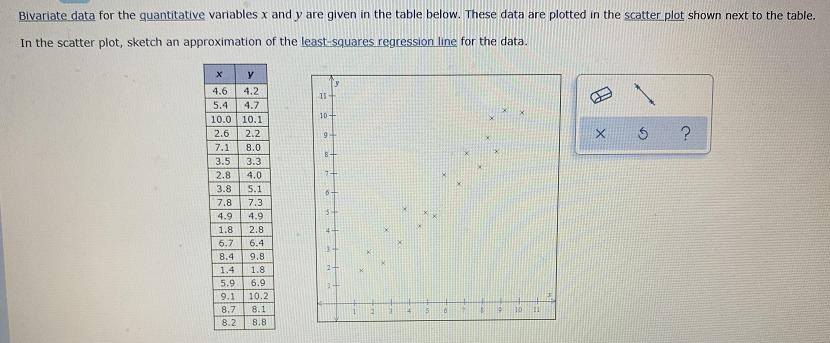
Bivariate data for the guantitative variables x and y are given in the table below. These data are plotted in the scatter plot shown next to the table. In the scatter plot, sketch an approximation of the least-squares regression line for the data. 4.6 4.2 5.4 4.7 10 10.0 10.1 2.6 2.2 9- 7.1 8.0 3.5 3.3 2.8 4.0 3.8 S.1 7.8 7.3 4.9 4.9 1.8 2.8 6.7 6.4 8.4 9.8 1.4 1.8 5.9 6.9 9.1 10.2 8,7 8.1 ITTE 8.2 8.8 2374 6
Step by Step Solution
★★★★★
3.49 Rating (156 Votes )
There are 3 Steps involved in it
1 Expert Approved Answer
Step: 1 Unlock

Question Has Been Solved by an Expert!
Get step-by-step solutions from verified subject matter experts
Step: 2 Unlock
Step: 3 Unlock