

Question: Test: Week 3 Test (6.1-6.6, 7.1-7.3) 0 Question 20 > Score: 0 of 5 points Subm Use a calculator or computer software to generate a
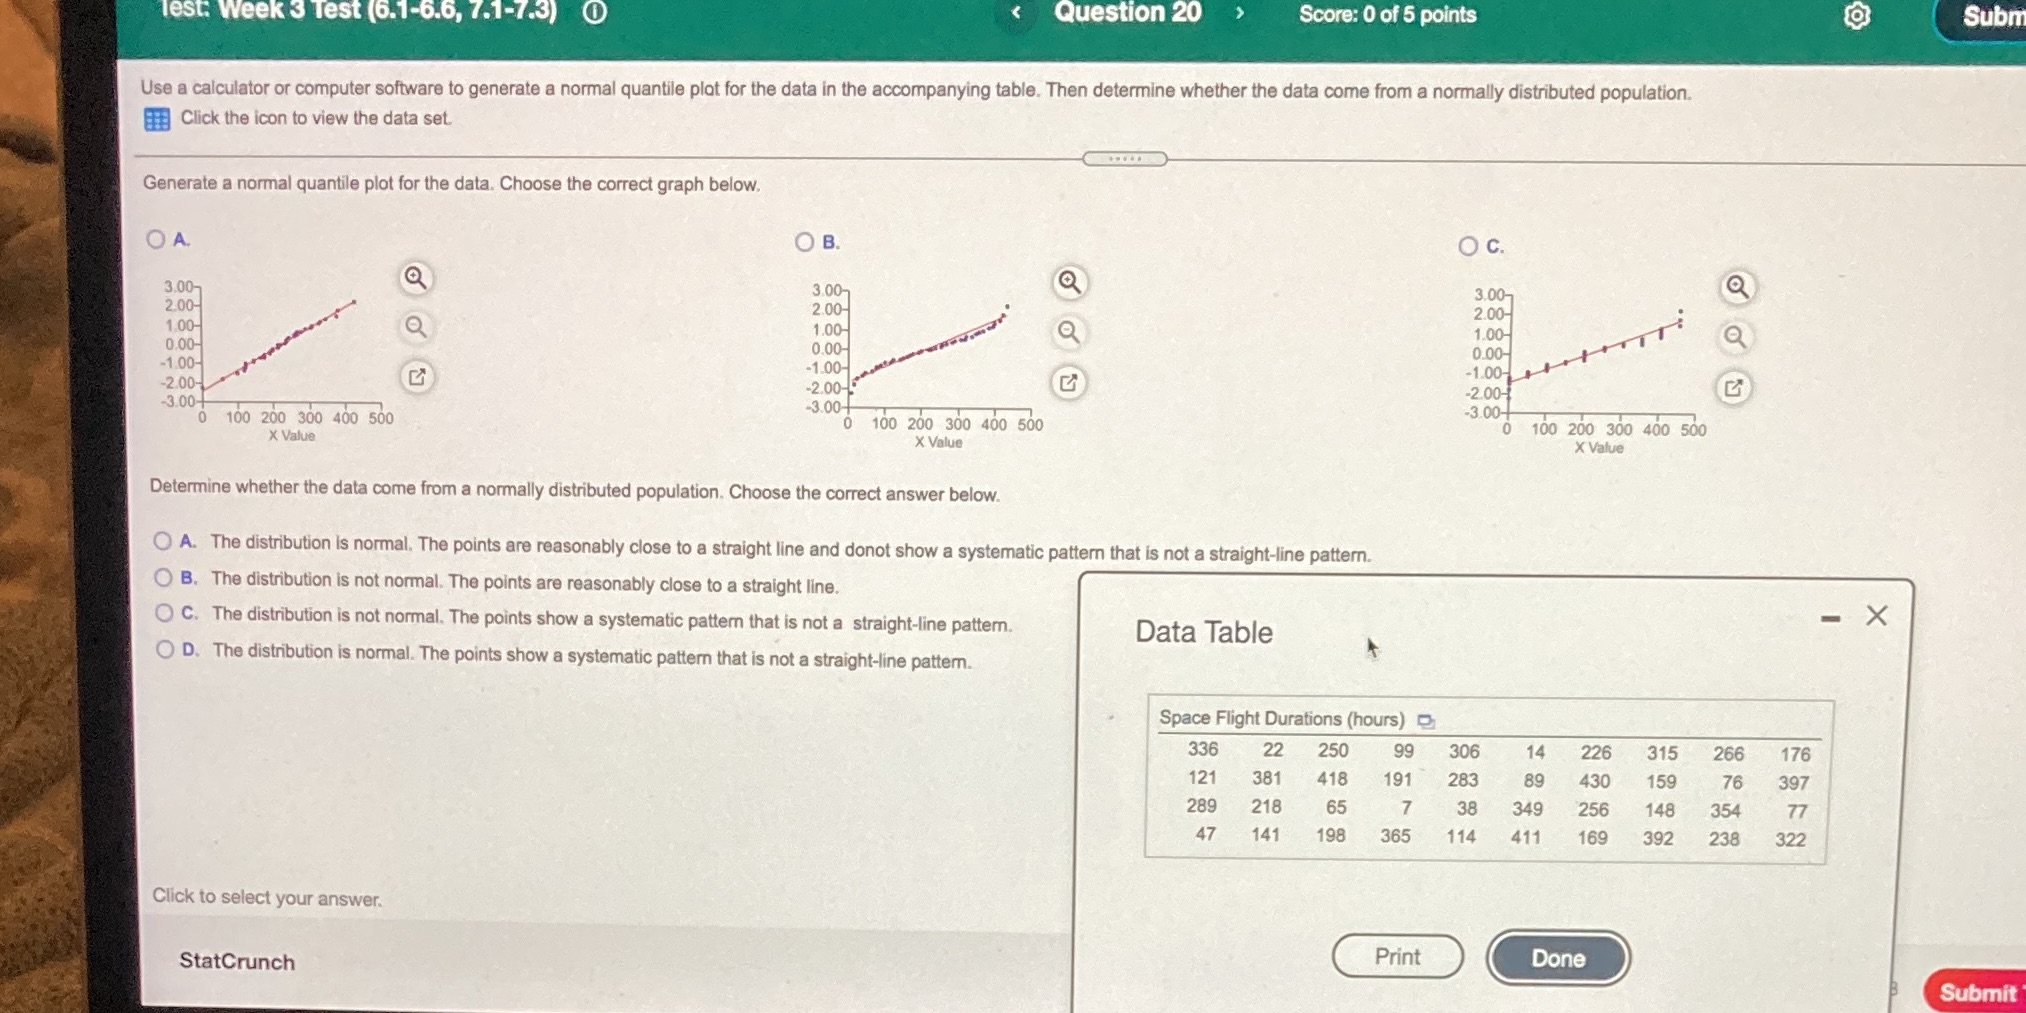
Test: Week 3 Test (6.1-6.6, 7.1-7.3) 0 Question 20 > Score: 0 of 5 points Subm Use a calculator or computer software to generate a normal quantile plot for the data in the accompanying table. Then determine whether the data come from a normally distributed population. Click the icon to view the data set. Generate a normal quantile plot for the data. Choose the correct graph below. O A. O B. O c. 3.00- 3.00- 3.00- 2.00- 2.00- 2.00- 1.00- Q 1.00- 1.00- 0.00- 0.00- 0.00- -1.00- -1.00- -1.00- -2.00- -2.00 -3.00- -2.00- 0 100 200 300 400 500 -3.00- 0 100 200 300 400 500 -3.00- 0 100 200 300 400 500 X Value X Value X Value Determine whether the data come from a normally distributed population. Choose the correct answer below. O A. The distribution is normal. The points are reasonably close to a straight line and donot show a systematic pattern that is not a straight-line pattern. O B. The distribution is not normal. The points are reasonably close to a straight line. O C. The distribution is not normal. The points show a systematic pattern that is not a straight-line pattern. X Data Table O D. The distribution is normal. The points show a systematic pattern that is not a straight-line pattern. Space Flight Durations (hours) 336 22 250 99 306 14 226 315 266 176 121 381 418 191 283 89 430 159 76 397 289 218 65 7 38 349 256 148 354 77 47 141 198 365 114 411 169 392 238 322 Click to select your answer. StatCrunch Print Done Submit
Step by Step Solution
There are 3 Steps involved in it

Get step-by-step solutions from verified subject matter experts