

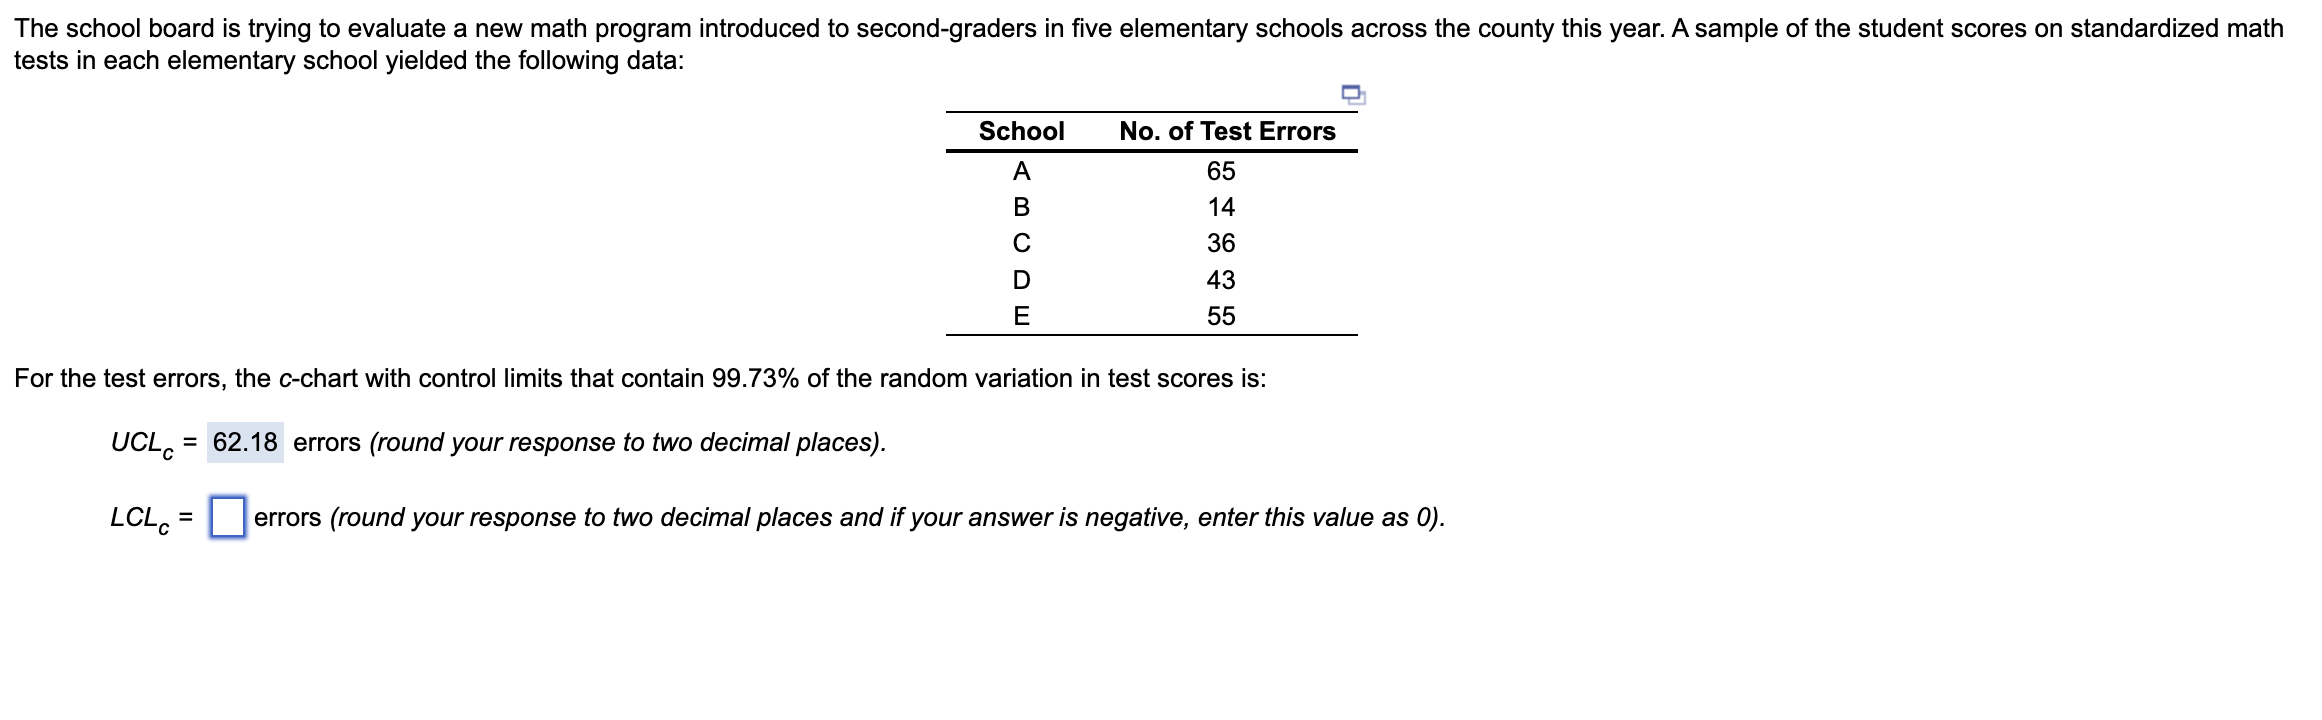
Question: tests in each elementary school yielded the following data: table [ [ School , No . of Test Errors ] , [ A ,
tests in each elementary school yielded the following data:
tableSchoolNo of Test ErrorsABCDE
For the test errors, the chart with control limits that contain of the random variation in test scores is:
errors round your response to two decimal places
errors round your response to two decimal places and if your answer is negative, enter this value as
Step by Step Solution
There are 3 Steps involved in it
1 Expert Approved Answer
Step: 1 Unlock

Question Has Been Solved by an Expert!
Get step-by-step solutions from verified subject matter experts
Step: 2 Unlock
Step: 3 Unlock