

Question: - . . th Achievement Test Scores The data shown represent the scores on a national achievement test for a group of 10 -grade students.
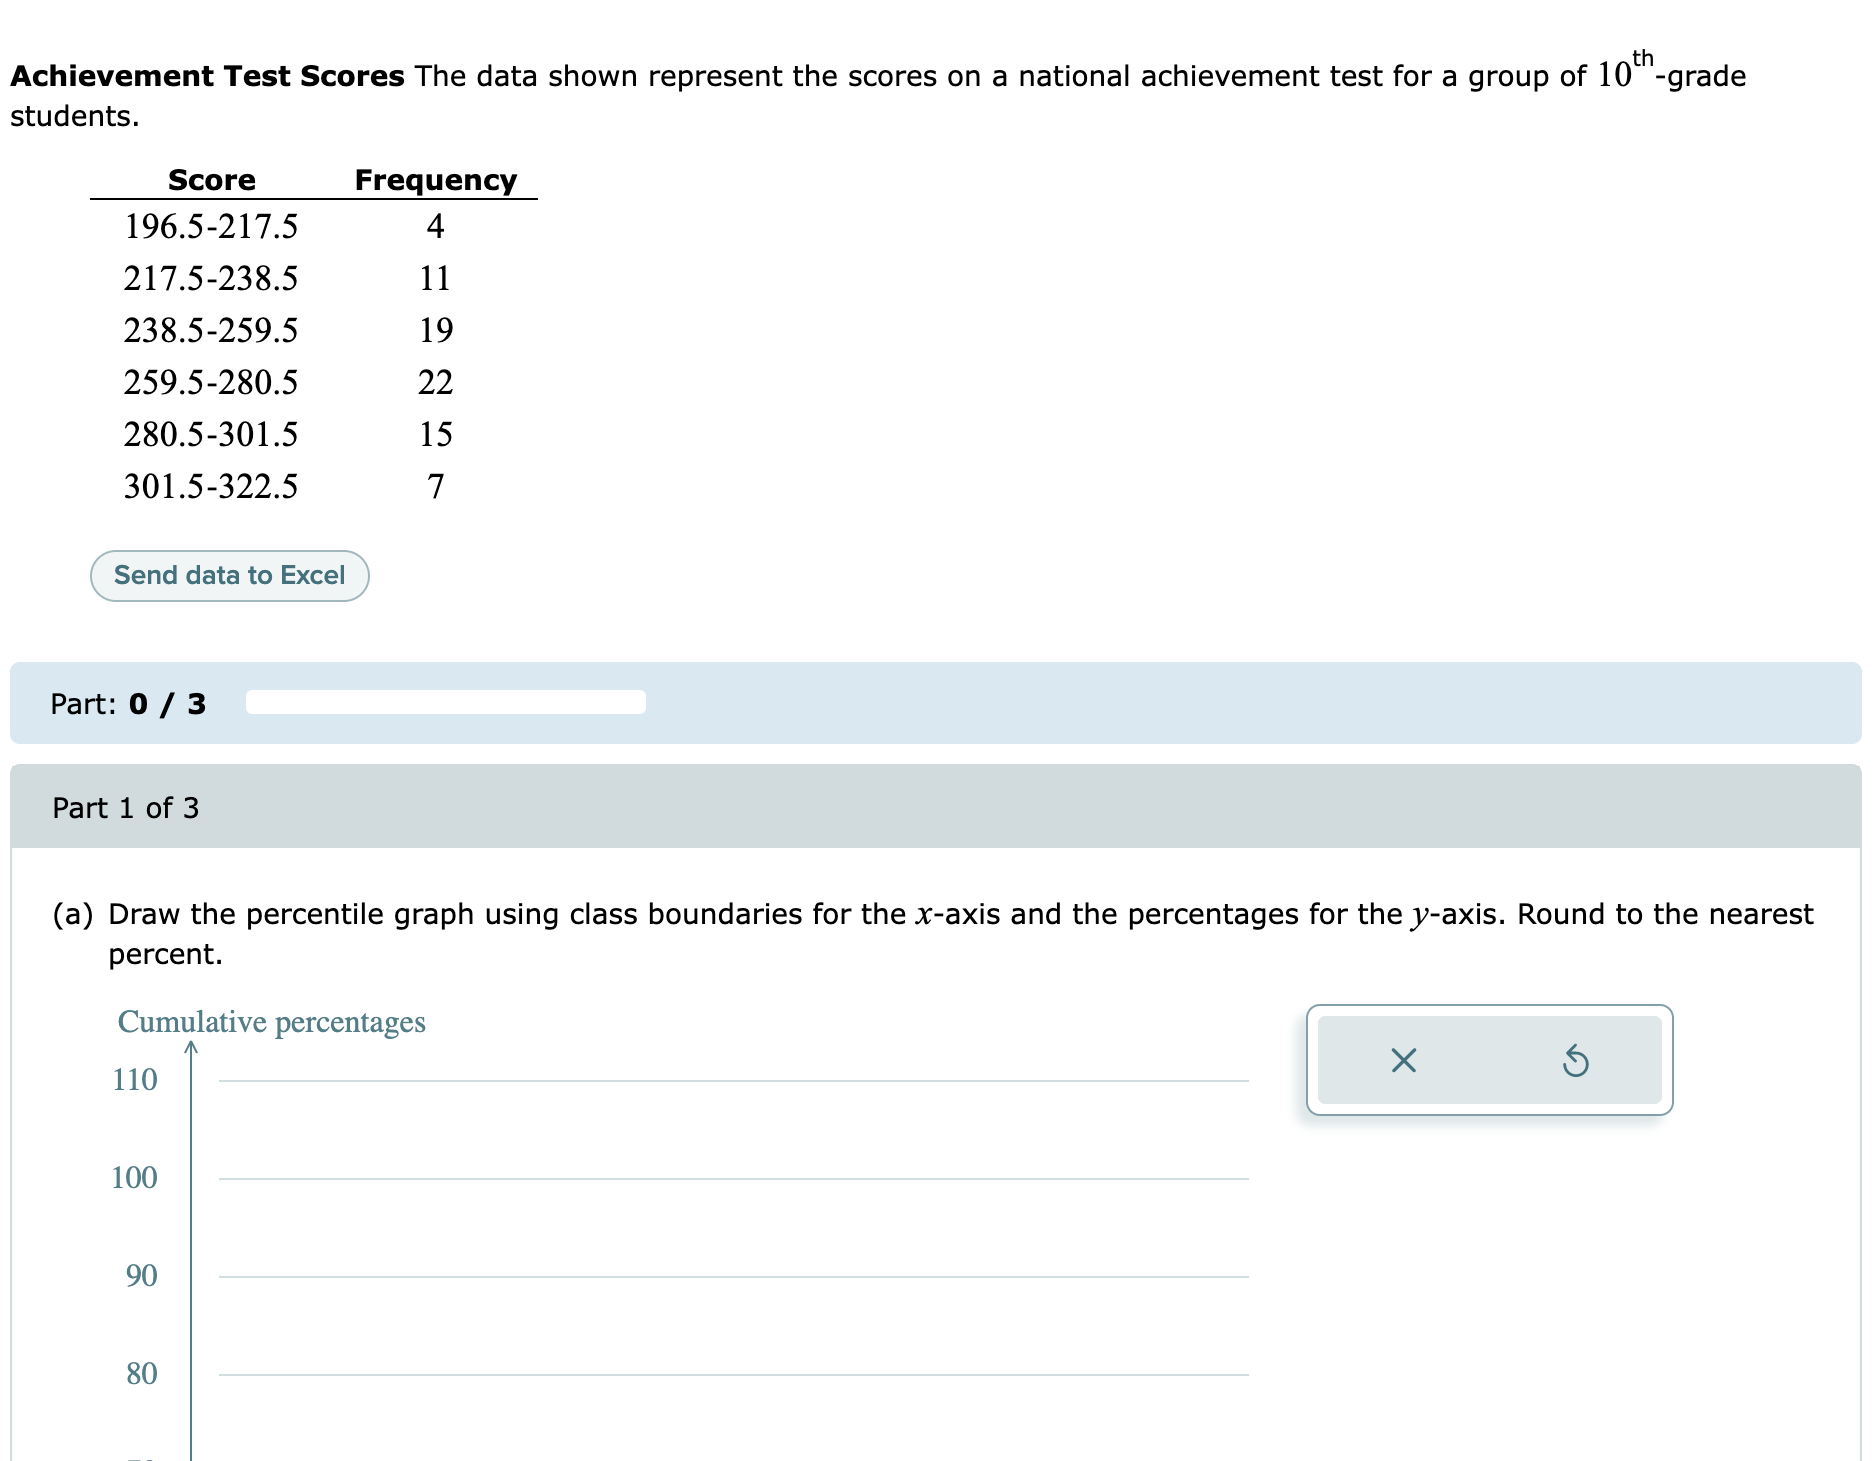
- . . th Achievement Test Scores The data shown represent the scores on a national achievement test for a group of 10 -grade students. Score Frequency 1965-2175 4 2175-2385 11 2385-2595 19 2595-2805 22 2805-3015 15 3015-3225 7 Send data to Excel (a) Draw the percentile graph using class boundaries for the x-axis and the percentages for the y-axis. Round to the nearest percent. Cumulative percentages 110 - 100 90 80
Step by Step Solution
There are 3 Steps involved in it
1 Expert Approved Answer
Step: 1 Unlock

Question Has Been Solved by an Expert!
Get step-by-step solutions from verified subject matter experts
Step: 2 Unlock
Step: 3 Unlock