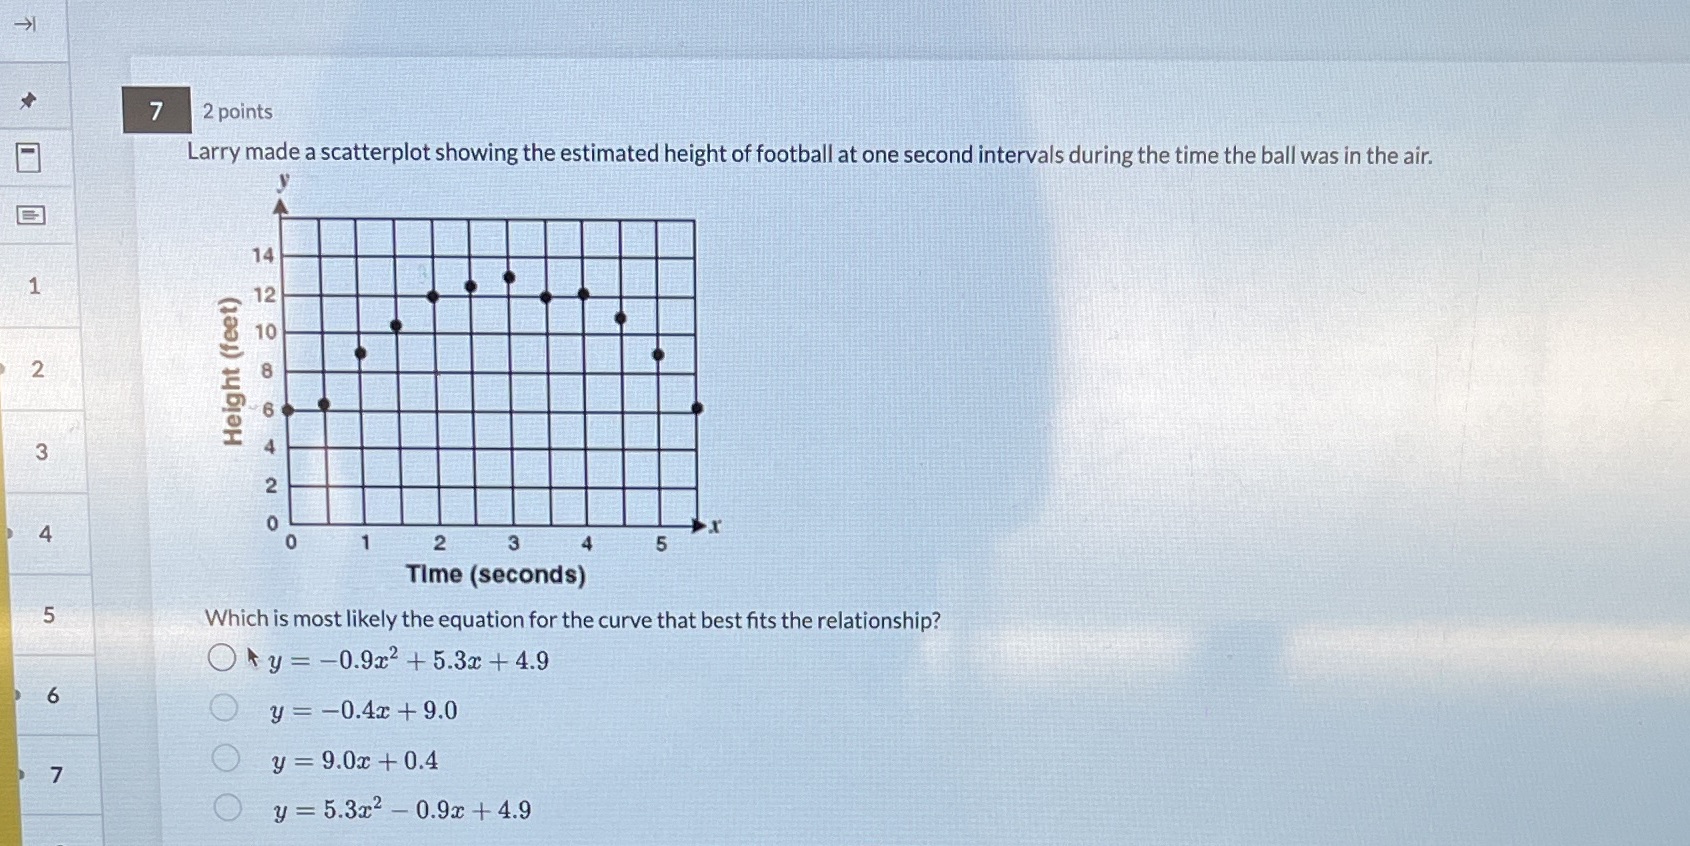
Question: Thank you 7 2 points Larry made a scatterplot showing the estimated height of football at one second intervals during the time the ball was

Thank you

Thank you 7 2 points Larry made a scatterplot
7 2 points Larry made a scatterplot showing the estimated height of football at one second intervals during the time the ball was in the air. 1 2 Height (feet) ONADOONE 3 4 2 3 5 Time (seconds) 5 Which is most likely the equation for the curve that best fits the relationship? Ory= -0.9x2 + 5.3x + 4.9 6 O y = -0.4r +9.0 7 O y = 9.0x + 0.4 O y = 5.3x2 - 0.9x + 4.9

Step by Step Solution

There are 3 Steps involved in it

1 Expert Approved Answer
Step: 1 Unlock blur-text-image
Question Has Been Solved by an Expert!

Get step-by-step solutions from verified subject matter experts

Step: 2 Unlock
Step: 3 Unlock

Students Have Also Explored These Related Mathematics Questions!