

Question: Thank you for your help. Data from 14 cities were combined for a 20-year period, and the total 280 city-years included a total of 140
Thank you for your help.
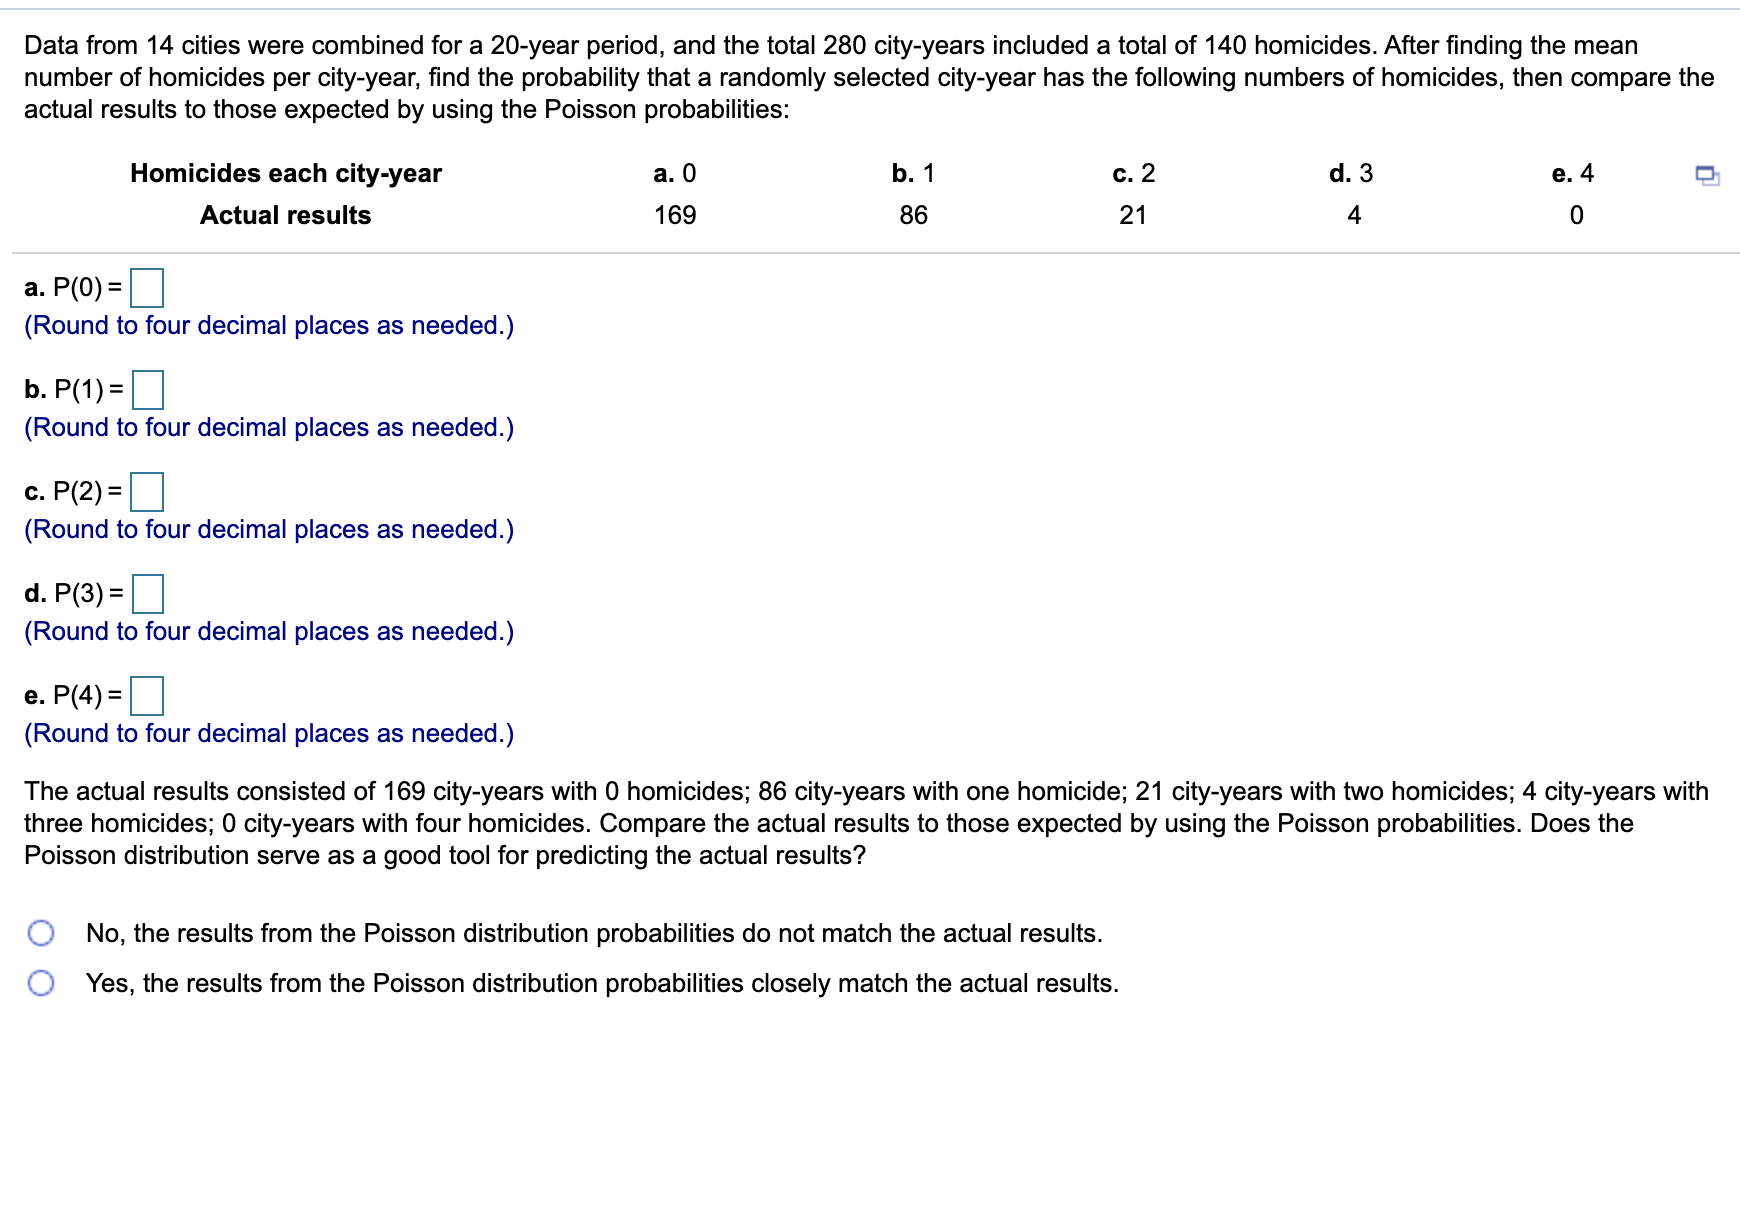
Data from 14 cities were combined for a 20-year period, and the total 280 city-years included a total of 140 homicides. After nding the mean number of homicides per city-year, nd the probability that a randomly selected city-year has the following numbers of homicides, then compare the actual results to those expected by using the Poisson probabilities: Homicides each city-year a. 0 b. 1 c. 2 d. 3 e. 4 [3 Actual results 169 86 21 4 0 a. P(0)= (Round to four decimal places as needed.) b.P(1)=|: (Round to four decimal places as needed.) c. P(2)= (Round to four decimal places as needed.) d. P(3) = C (Round to four decimal places as needed.) e. P(4)= (Round to four decimal places as needed.) The actual results consisted of 169 city-years with O homicides; 86 city-years with one homicide; 21 city-years with two homicides; 4 city-years with three homicides; O cityyears with four homicides. Compare the actual results to those expected by using the Poisson probabilities. Does the Poisson distribution serve as a good tool for predicting the actual results? 0 No, the results from the Poisson distribution probabilities do not match the actual results. 0 Yes, the results from the Poisson distribution probabilities closely match the actual results
Step by Step Solution
There are 3 Steps involved in it

Get step-by-step solutions from verified subject matter experts