

Question: Thank you in advance! Problem 13-1A Here are comparative statement data for Crane Company and Sheridan Company, two competitors. All balance sheet data are as
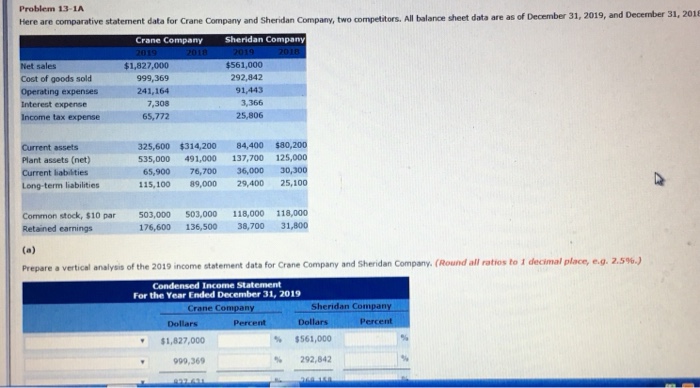
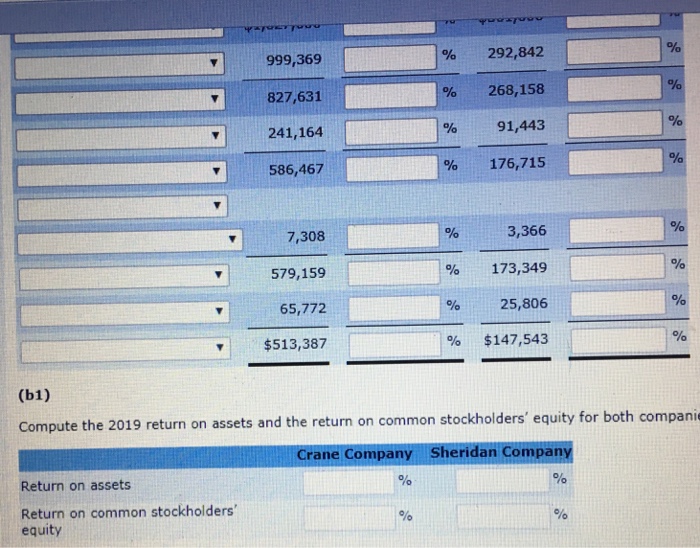
Problem 13-1A Here are comparative statement data for Crane Company and Sheridan Company, two competitors. All balance sheet data are as of December 31, 2019, and December 31, 2011 Crane Company Sheridan Company Net sales Cost of goods sold Operating expenses Interest expense Income tax expense $1,827,000 999,369 241,164 7,308 65,772 $561,000 292,842 91,443 3,366 25,806 Current assets Plant assets (net) Current liabiities Long-term liabilities115,100 325,600 $314,200 84,400 $80,200 535,000 491,000 137,700 125,000 65,900 76,700 36,000 30,300 25,100 89,000 29,400 Common stock, $10 par 503,000 503,000 118,000 118,000 Retained earnings 176,600 136,500 38,700 31,800 decimal place, e.g. 2.596.) Prepare a vertical analysis of the 2019 income statement data for Crane Company and Sheridan Company, (Round all ratios to Condensed Income Statement For the Year Ended December 31, 2019 Crane C Sheridan Company $1,827,000 $561,000 999,369 % 292,842
Step by Step Solution
There are 3 Steps involved in it

Get step-by-step solutions from verified subject matter experts